SunTrust 2015 Annual Report Download - page 55
Download and view the complete annual report
Please find page 55 of the 2015 SunTrust annual report below. You can navigate through the pages in the report by either clicking on the pages listed below, or by using the keyword search tool below to find specific information within the annual report.-
 1
1 -
2
-
3
-
4
-
5
-
6
-
7
-
8
-
9
-
10
-
11
-
12
-
13
-
14
-
15
-
16
-
17
-
18
-
19
-
20
-
21
-
22
-
23
-
24
-
25
-
26
-
27
-
28
-
29
-
30
-
31
-
32
-
33
-
34
-
35
-
36
-
37
-
38
-
39
-
40
-
41
-
42
-
43
-
44
-
 45
45 -
 46
46 -
 47
47 -
 48
48 -
 49
49 -
 50
50 -
 51
51 -
 52
52 -
 53
53 -
 54
54 -
 55
55 -
 56
56 -
 57
57 -
 58
58 -
 59
59 -
 60
60 -
 61
61 -
 62
62 -
 63
63 -
 64
64 -
 65
65 -
66
-
67
-
68
-
69
-
70
-
71
-
72
-
73
-
74
-
75
-
76
-
77
-
78
-
79
-
80
-
81
-
82
-
83
-
84
-
85
-
86
-
87
-
88
-
89
-
90
-
91
-
92
-
93
-
94
-
95
-
96
-
97
-
98
-
99
-
100
-
101
-
102
-
103
-
104
-
105
-
106
-
107
-
108
-
109
-
110
-
111
-
112
-
113
-
114
-
115
-
116
-
117
-
118
-
119
-
120
-
121
-
122
-
123
-
124
-
125
-
126
-
127
-
128
-
129
-
130
-
131
-
132
-
133
-
134
-
135
-
136
-
137
-
138
-
139
-
140
-
141
-
142
-
143
-
144
-
145
-
146
-
147
-
148
-
149
-
150
-
151
-
152
-
153
-
154
-
155
-
156
-
157
-
158
-
159
-
160
-
161
-
162
-
163
-
164
-
165
-
166
-
167
-
168
-
169
-
170
-
171
-
172
-
173
-
174
-
175
-
176
-
177
-
178
-
179
-
180
-
181
-
182
-
183
-
184
-
185
-
186
-
187
-
188
-
189
-
190
-
191
-
192
-
193
-
194
-
195
-
196
 |
 |

27
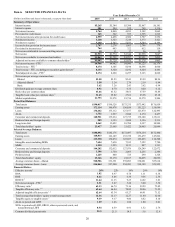
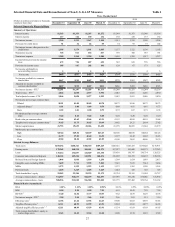
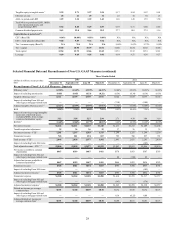
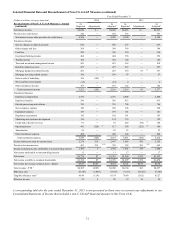
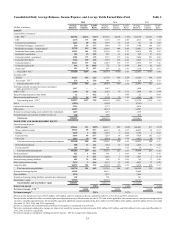
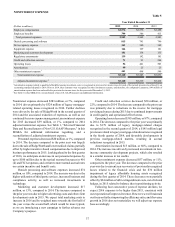
Selected Financial Data and Reconcilement of Non-U.S. GAAP Measures Table 1
Three Months Ended
(Dollars in millions and shares in thousands,
except per share data)
2015 2014
December 31 September 30 June 30 March 31 December 31 September 30 June 30 March 31
Selected Quarterly Financial Data
Summary of Operations:
Interest income $1,363 $1,333 $1,297 $1,272 $1,349 $1,353 $1,346 $1,336
Interest expense 117 122 130 132 138 138 137 132
Net interest income 1,246 1,211 1,167 1,140 1,211 1,215 1,209 1,204
Provision for credit losses 51 32 26 55 74 93 73 102
Net interest income after provision for
credit losses 1,195 1,179 1,141 1,085 1,137 1,122 1,136 1,102
Noninterest income 765 811 874 817 795 780 957 791
Noninterest expense 1,288 1,264 1,328 1,280 1,410 1,259 1,517 1,357
Income before provision for income
taxes 672 726 687 622 522 643 576 536
Provision for income taxes 185 187 202 191 128 67 173 125
Net income attributable to
noncontrolling interest 3 2 2 2 — — 4 6
Net income $484 $537 $483 $429 $394 $576 $399 $405
Net income available to common
shareholders $467 $519 $467 $411 $378 $563 $387 $393
Adjusted net income available to
common shareholders 1 $467 $519 $467 $411 $466 $433 $436 $393
Net interest income - FTE 2$1,281 $1,247 $1,203 $1,175 $1,248 $1,251 $1,244 $1,239
Total revenue - FTE 22,046 2,058 2,077 1,992 2,043 2,031 2,201 2,030
Total adjusted revenue - FTE 1, 2 2,046 2,058 2,077 1,992 2,043 2,031 2,096 2,030
Net income per average common share:
Diluted $0.91 $1.00 $0.89 $0.78 $0.72 $1.06 $0.72 $0.73
Adjusted diluted 10.91 1.00 0.89 0.78 0.88 0.81 0.81 0.73
Basic 0.92 1.01 0.90 0.79 0.72 1.07 0.73 0.74
Dividends paid per average common
share 0.24 0.24 0.24 0.20 0.20 0.20 0.20 0.10
Book value per common share 43.66 43.65 42.46 42.21 41.52 40.85 40.18 39.44
Tangible book value per common share 331.65 31.75 30.65 30.49 29.82 29.21 28.64 27.82
Market capitalization 21,793 19,659 22,286 21,450 21,978 20,055 21,344 21,279
Market price per common share:
High $45.24 $45.84 $44.69 $43.23 $43.06 $40.86 $40.84 $41.26
Low 36.79 37.09 40.40 36.52 33.97 36.42 36.82 36.23
Close 42.84 38.24 43.02 41.09 41.90 38.03 40.06 39.79
Selected Average Balances:
Total assets $189,656 $188,341 $188,310 $189,265 $188,341 $183,433 $179,820 $176,971
Earning assets 170,262 168,334 168,461 168,179 167,227 163,688 160,373 157,343
Loans 135,214 132,837 132,829 133,338 133,438 130,747 130,734 128,525
Consumer and commercial deposits 148,163 145,226 142,851 140,476 136,892 132,195 130,472 128,396
Brokered time and foreign deposits 1,046 1,010 1,118 1,250 1,399 1,624 1,893 2,013
Intangible assets including MSRs 7,629 7,711 7,572 7,502 7,623 7,615 7,614 7,666
MSRs 1,273 1,352 1,223 1,152 1,272 1,262 1,220 1,265
Preferred stock 1,225 1,225 1,225 1,225 1,024 725 725 725
Total shareholders’ equity 23,583 23,384 23,239 23,172 22,754 22,191 21,994 21,727
Average common shares - diluted 514,507 518,677 522,479 526,837 527,959 533,230 535,486 536,992
Average common shares - basic 508,536 513,010 516,968 521,020 521,775 527,402 529,764 531,162
Financial Ratios (Annualized):
ROA 1.01% 1.13% 1.03% 0.92% 0.83% 1.25% 0.89% 0.93%
ROE 8.28 9.30 8.50 7.59 6.91 10.41 7.29 7.59
ROTCE 4 11.40 12.84 11.77 10.53 9.62 14.59 10.29 10.78
Net interest margin - FTE 22.98 2.94 2.86 2.83 2.96 3.03 3.11 3.19
Efficiency ratio 562.96 61.44 63.92 64.23 69.00 62.03 68.93 66.83
Tangible efficiency ratio 662.11 60.99 63.59 63.91 68.44 61.69 68.77 66.65
Adjusted tangible efficiency ratio 1, 6 62.11 60.99 63.59 63.91 61.34 61.69 63.69 66.65
Total average shareholders’ equity to
total average assets 12.43 12.42 12.34 12.24 12.08 12.10 12.23 12.28