SunTrust 2015 Annual Report Download - page 4
Download and view the complete annual report
Please find page 4 of the 2015 SunTrust annual report below. You can navigate through the pages in the report by either clicking on the pages listed below, or by using the keyword search tool below to find specific information within the annual report.-
 1
1 -
 2
2 -
 3
3 -
 4
4 -
 5
5 -
 6
6 -
 7
7 -
 8
8 -
 9
9 -
 10
10 -
 11
11 -
 12
12 -
 13
13 -
 14
14 -
 15
15 -
16
-
17
-
18
-
19
-
20
-
21
-
22
-
23
-
24
-
25
-
26
-
27
-
28
-
29
-
30
-
31
-
32
-
33
-
34
-
35
-
36
-
37
-
38
-
39
-
40
-
41
-
42
-
43
-
44
-
45
-
46
-
47
-
48
-
49
-
50
-
51
-
52
-
53
-
54
-
55
-
56
-
57
-
58
-
59
-
60
-
61
-
62
-
63
-
64
-
65
-
66
-
67
-
68
-
69
-
70
-
71
-
72
-
73
-
74
-
75
-
76
-
77
-
78
-
79
-
80
-
81
-
82
-
83
-
84
-
85
-
86
-
87
-
88
-
89
-
90
-
91
-
92
-
93
-
94
-
95
-
96
-
97
-
98
-
99
-
100
-
101
-
102
-
103
-
104
-
105
-
106
-
107
-
108
-
109
-
110
-
111
-
112
-
113
-
114
-
115
-
116
-
117
-
118
-
119
-
120
-
121
-
122
-
123
-
124
-
125
-
126
-
127
-
128
-
129
-
130
-
131
-
132
-
133
-
134
-
135
-
136
-
137
-
138
-
139
-
140
-
141
-
142
-
143
-
144
-
145
-
146
-
147
-
148
-
149
-
150
-
151
-
152
-
153
-
154
-
155
-
156
-
157
-
158
-
159
-
160
-
161
-
162
-
163
-
164
-
165
-
166
-
167
-
168
-
169
-
170
-
171
-
172
-
173
-
174
-
175
-
176
-
177
-
178
-
179
-
180
-
181
-
182
-
183
-
184
-
185
-
186
-
187
-
188
-
189
-
190
-
191
-
192
-
193
-
194
-
195
-
196
 |
 |

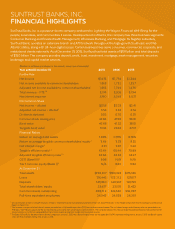
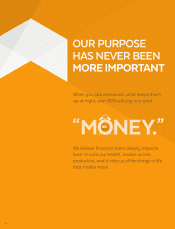
remain firmly committed to achieving our long-term goal of being
below 60%, which will be a key driver of delivering additional value
to you, our shareholders.
Average performing loans grew $3 billion, or 2%, driven by growth
in C&I and our consumer direct portfolio, partially offset by
elevated payoffs and loan sales in other areas, as we continued
our focus on returns. We have sold or securitized approximately $5
billion of loans since the middle of 2014 to advance our balance
sheet optimization strategy, though I would not expect this pace to
continue in the near- to medium-term.
Average client deposits grew $12 billion, or 9%, driven by growth
across each major line of business. This reflects our overall
strategic focus on meeting more clients’ deposit and payment
needs, supplemented by investments in technology platforms and
client-facing bankers across both the Consumer & Private Wealth
and Wholesale segments. In particular, our Wholesale Banking
segment continues to do an outstanding job of deepening client
relationships with our enhanced Treasury & Payment Solutions
(T&PS) product offerings. Our strong deposit growth directly
enabled us to reduce higher-cost long-term debt by $4.6 billion, or
35%, over the past year.
Asset quality continued to be strong, as net charge-offs declined
23% to 0.26% of average loans, and nonperforming loans remained
relatively low at 0.49% of total loans, both contributing to an
approximately 50% reduction in the provision for credit losses. This
performance was the result of improving economic conditions in
our markets, in addition to the significant actions we have taken
over the past several years to improve the quality of our loan
portfolio and de-risk our balance sheet. As an example, we sold
$122 million of nonperforming loans in 2015. Notwithstanding
these activities and generally stable economic conditions, we
recognize that the prolonged level of low oil prices will place
stress on our energy clients, and given this, we expect modest
deterioration in our asset quality metrics in 2016. With that said,
any adverse effects will be manageable in the context of our overall
Company, as energy-related loan balances, as of December 31,
2015, comprised 2% of our loan portfolio.
Acknowledging our improved asset quality and increased
profitability in 2015, Fitch Ratings upgraded our senior long-term
credit rating to “A-” from “BBB+” in the fourth quarter, continuing
our trajectory of improving credit ratings.
Our capital position remains strong, with the Basel III Common
Equity Tier 1 ratio ending the year at 9.8% on a fully phased-in
basis.1 In addition, as I noted earlier, tangible book value per share1
increased 6% from the prior year, which we delivered alongside
a 39% increase in our capital return to shareholders. Our strong
capital position, combined with an improved risk profile, should
help us increase capital returns to shareholders in the coming year,
while also leaving ample capital for organic growth and investment.
As we look to 2016, we believe the U.S. economy, particularly within
many of our markets, is on steady footing and should support our
ability to deepen client relationships and expand our business.
However, the tailwinds we have experienced from improving asset
quality will abate and, thus, delivering positive operating leverage in
2016 will be critical in helping to mitigate the impact of this transition.
Longer term, I am very optimistic about our Company’s potential,
as we continue to execute our core strategies. As you’ll recall, in
2011 we developed three primary strategies to enable us to better
serve our clients, teammates, communities, and shareholders:
(1) meeting more client needs, (2) improving efficiency, and (3)
optimizing the balance sheet to enhance returns. We have been
diligently executing these strategies since that time and expect
them to be our primary focus over the medium-term. Our success
over the last four years, in part demonstrated by our 154% total
shareholder return2, gives us confidence that we are headed in the
right strategic direction.
MEETING MORE CLIENT NEEDS
We are a Top 10 bank across most dimensions and are therefore large
enough to have the breadth of capabilities to meet an array of client
needs. However, we are also small enough to be nimble and reactive
to evolving client preferences and market conditions. For these
reasons, we believe our size is an advantage. Our range of capabilities,
combined with our SunTrust OneTeam Approach,
SM allows us the
unique opportunity to deliver the entire bank to our clients.
We continued to meet more of our clients’ needs in 2015, as
evidenced by growth in investment banking income, credit card
penetration, and total deposits. Going forward, we will continue to be
highly focused on deepening client relationships, with an increased
emphasis on working together across segments and lines of business.
Within Corporate and Investment Banking (CIB), we have been
consistently focused on three priorities over the past decade: (1)
continuing our targeted build out of product and industry expertise,
(2) working diligently to acquire new clients and deepen existing
relationships, and (3) leveraging our OneTeam Approach to meet the
capital markets needs of all SunTrust clients. 2015 was a record year
1 See reconciliation of non-U.S. GAAP measures in Table 1, “Selected Financial Data and Reconcilement of Non-U.S. GAAP Measures,” in the MD&A section (Item 7) of the Company’s 2015 Annual
Report on Form 10-K.
2
For the four years ended December 31, 2015.
2