SunTrust 2015 Annual Report Download - page 58
Download and view the complete annual report
Please find page 58 of the 2015 SunTrust annual report below. You can navigate through the pages in the report by either clicking on the pages listed below, or by using the keyword search tool below to find specific information within the annual report.-
 1
1 -
2
-
3
-
4
-
5
-
6
-
7
-
8
-
9
-
10
-
11
-
12
-
13
-
14
-
15
-
16
-
17
-
18
-
19
-
20
-
21
-
22
-
23
-
24
-
25
-
26
-
27
-
28
-
29
-
30
-
31
-
32
-
33
-
34
-
35
-
36
-
37
-
38
-
39
-
40
-
41
-
42
-
43
-
44
-
45
-
46
-
47
-
 48
48 -
 49
49 -
 50
50 -
 51
51 -
 52
52 -
 53
53 -
 54
54 -
 55
55 -
 56
56 -
 57
57 -
 58
58 -
 59
59 -
 60
60 -
 61
61 -
 62
62 -
 63
63 -
 64
64 -
 65
65 -
 66
66 -
 67
67 -
 68
68 -
69
-
70
-
71
-
72
-
73
-
74
-
75
-
76
-
77
-
78
-
79
-
80
-
81
-
82
-
83
-
84
-
85
-
86
-
87
-
88
-
89
-
90
-
91
-
92
-
93
-
94
-
95
-
96
-
97
-
98
-
99
-
100
-
101
-
102
-
103
-
104
-
105
-
106
-
107
-
108
-
109
-
110
-
111
-
112
-
113
-
114
-
115
-
116
-
117
-
118
-
119
-
120
-
121
-
122
-
123
-
124
-
125
-
126
-
127
-
128
-
129
-
130
-
131
-
132
-
133
-
134
-
135
-
136
-
137
-
138
-
139
-
140
-
141
-
142
-
143
-
144
-
145
-
146
-
147
-
148
-
149
-
150
-
151
-
152
-
153
-
154
-
155
-
156
-
157
-
158
-
159
-
160
-
161
-
162
-
163
-
164
-
165
-
166
-
167
-
168
-
169
-
170
-
171
-
172
-
173
-
174
-
175
-
176
-
177
-
178
-
179
-
180
-
181
-
182
-
183
-
184
-
185
-
186
-
187
-
188
-
189
-
190
-
191
-
192
-
193
-
194
-
195
-
196
 |
 |
30
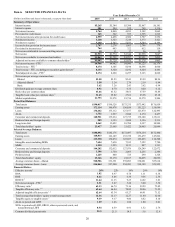
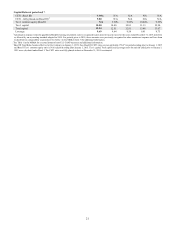
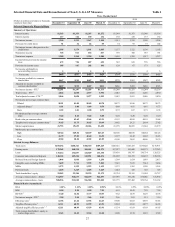
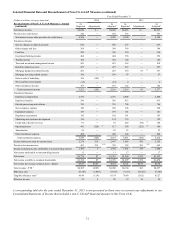
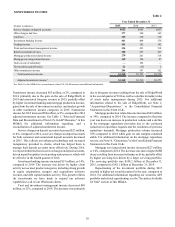
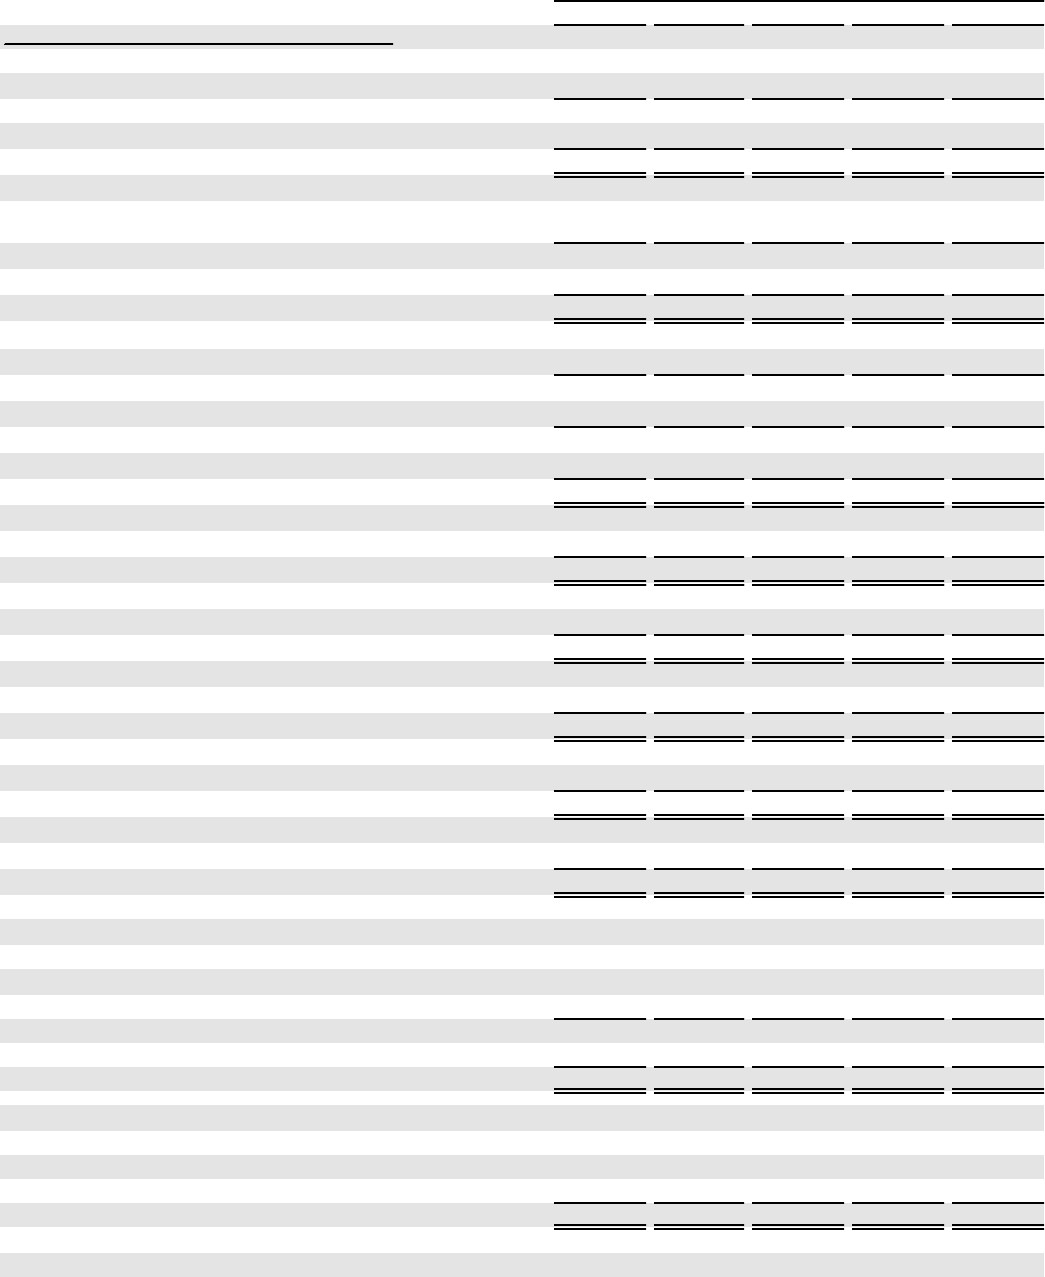
Selected Financial Data and Reconcilement of Non-U.S. GAAP Measures (continued)
Year Ended December 31
(Dollars in millions, except per share data) 2015 2014 2013 2012 2011
Reconcilement of Non-U.S. GAAP Measures - Annual
Efficiency ratio 5, 12 63.13% 66.74% 71.16% 59.29% 72.02%
Impact of excluding amortization (0.49) (0.30) (0.27) (0.43) (0.50)
Tangible efficiency ratio 6, 12 62.64 66.44 70.89 58.86 71.52
Impact of excluding Form 8-K and other legacy mortgage-related items —(3.10) (5.62) 8.05 —
Adjusted tangible efficiency ratio 1, 6, 12 62.64% 63.34% 65.27% 66.91% 71.52%
ROE 8.42% 8.06% 6.34% 9.56% 2.56%
Impact of removing average intangible assets (net of deferred taxes), excluding
MSRs, from average common shareholders' equity 3.22 3.27 2.91 4.46 1.27
ROTCE 4 11.64 11.33 9.25 14.02 3.83
Impact of excluding Form 8-K and other legacy mortgage-related items —0.04 1.27 (5.47) —
Adjusted ROTCE 1, 4 11.64% 11.37% 10.52% 8.55% 3.83%
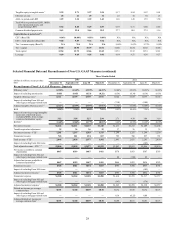
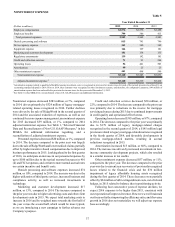
Net interest income $4,764 $4,840 $4,853 $5,102 $5,065
Taxable-equivalent adjustment 142 142 127 123 114
Net interest income - FTE 24,906 4,982 4,980 5,225 5,179
Noninterest income 3,268 3,323 3,214 5,373 3,421
Total revenue - FTE 2 8,174 8,305 8,194 10,598 8,600
Impact of excluding Form 8-K items —(105) 63 (1,475) —
Total adjusted revenue - FTE 1, 2 $8,174 $8,200 $8,257 $9,123 $8,600
Net income available to common shareholders $1,863 $1,722 $1,297 $1,931 $495
Impact of excluding Form 8-K and other legacy mortgage-related items —7 179 (753) —
Adjusted net income available to common shareholders 1 $1,863 $1,729 $1,476 $1,178 $495
Total revenue - FTE 2$8,174 $8,305 $8,194 $10,598 $8,600
Impact of excluding net securities gains/(losses) 21 (15) 2 1,974 117
Total revenue - FTE, excluding net securities gains/(losses) 2, 13 $8,153 $8,320 $8,192 $8,624 $8,483
Noninterest income $3,268 $3,323 $3,214 $5,373 $3,421
Impact of excluding Form 8-K items —(105) 63 (1,475) —
Adjusted noninterest income 1 $3,268 $3,218 $3,277 $3,898 $3,421
Noninterest expense 12 $5,160 $5,543 $5,831 $6,284 $6,194
Impact of excluding Form 8-K and other legacy mortgage-related items —(324) (419) (134) —
Adjusted noninterest expense 1, 12 $5,160 $5,219 $5,412 $6,150 $6,194
Diluted net income per average common share $3.58 $3.23 $2.41 $3.59 $0.94
Impact of excluding Form 8-K and other legacy mortgage-related items —0.01 0.33 (1.40) —
Adjusted diluted net income per average common share 1$3.58 $3.24 $2.74 $2.19 $0.94
At December 31:
Total shareholders’ equity $23,437 $23,005 $21,422 $20,985 $20,066
Goodwill, net of deferred taxes 9(6,097) (6,123) (6,183) (6,206) (6,190)
Other intangible assets, net of deferred taxes, and MSRs 10 (1,322) (1,219) (1,332) (949) (1,001)
MSRs 1,307 1,206 1,300 899 921
Tangible equity 17,325 16,869 15,207 14,729 13,796
Preferred stock (1,225) (1,225) (725) (725) (275)
Tangible common equity $16,100 $15,644 $14,482 $14,004 $13,521
Total assets $190,817 $190,328 $175,335 $173,442 $176,859
Goodwill (6,337) (6,337) (6,369) (6,369) (6,344)
Other intangible assets including MSRs (1,325) (1,219) (1,334) (956) (1,017)
MSRs 1,307 1,206 1,300 899 921
Tangible assets $184,462 $183,978 $168,932 $167,016 $170,419
Tangible equity to tangible assets 79.39% 9.17% 9.00% 8.82% 8.10%
Tangible book value per common share 3 $31.65 $29.82 $27.01 $25.98 $25.18