SunTrust 2015 Annual Report Download - page 53
Download and view the complete annual report
Please find page 53 of the 2015 SunTrust annual report below. You can navigate through the pages in the report by either clicking on the pages listed below, or by using the keyword search tool below to find specific information within the annual report.-
 1
1 -
2
-
3
-
4
-
5
-
6
-
7
-
8
-
9
-
10
-
11
-
12
-
13
-
14
-
15
-
16
-
17
-
18
-
19
-
20
-
21
-
22
-
23
-
24
-
25
-
26
-
27
-
28
-
29
-
30
-
31
-
32
-
33
-
34
-
35
-
36
-
37
-
38
-
39
-
40
-
41
-
42
-
 43
43 -
 44
44 -
 45
45 -
 46
46 -
 47
47 -
 48
48 -
 49
49 -
 50
50 -
 51
51 -
 52
52 -
 53
53 -
 54
54 -
 55
55 -
 56
56 -
 57
57 -
 58
58 -
 59
59 -
 60
60 -
 61
61 -
 62
62 -
 63
63 -
64
-
65
-
66
-
67
-
68
-
69
-
70
-
71
-
72
-
73
-
74
-
75
-
76
-
77
-
78
-
79
-
80
-
81
-
82
-
83
-
84
-
85
-
86
-
87
-
88
-
89
-
90
-
91
-
92
-
93
-
94
-
95
-
96
-
97
-
98
-
99
-
100
-
101
-
102
-
103
-
104
-
105
-
106
-
107
-
108
-
109
-
110
-
111
-
112
-
113
-
114
-
115
-
116
-
117
-
118
-
119
-
120
-
121
-
122
-
123
-
124
-
125
-
126
-
127
-
128
-
129
-
130
-
131
-
132
-
133
-
134
-
135
-
136
-
137
-
138
-
139
-
140
-
141
-
142
-
143
-
144
-
145
-
146
-
147
-
148
-
149
-
150
-
151
-
152
-
153
-
154
-
155
-
156
-
157
-
158
-
159
-
160
-
161
-
162
-
163
-
164
-
165
-
166
-
167
-
168
-
169
-
170
-
171
-
172
-
173
-
174
-
175
-
176
-
177
-
178
-
179
-
180
-
181
-
182
-
183
-
184
-
185
-
186
-
187
-
188
-
189
-
190
-
191
-
192
-
193
-
194
-
195
-
196
 |
 |
25
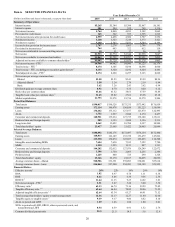
in certain areas, remains challenging overall. Nonetheless, we
remain firmly committed to our long-term efficiency target of
below 60%, and will continue to diligently manage expenses
while also investing in strategic, revenue generating initiatives,
as achieving these objectives will be critical to delivering
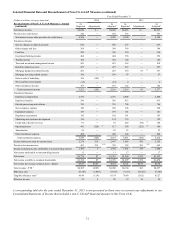
additional value to our shareholders. See Table 1, "Selected
Financial Data and Reconcilement of Non-U.S. GAAP
Measures," in this MD&A for additional information regarding,
and reconciliations of, our tangible and adjusted tangible
efficiency ratios.
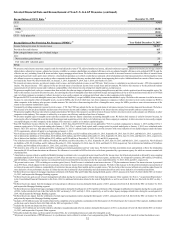
Our asset quality performance was strong during 2015. Total
NPAs were down 6% compared to December 31, 2014, driven
largely by the sale of $122 million in nonperforming mortgages
during 2015. Reductions in OREO also continued, declining
43% from the prior year to $56 million, the lowest level since
2006. At December 31, 2015, the ALLL balance equaled 1.29%
of total LHFI, a decline of 17 basis points compared to
December 31, 2014. The provision for loan losses decreased
$182 million, or 54%, compared to 2014, attributed to the
continued improvement in credit quality trends, particularly in
our residential loan portfolio, and lower net charge-offs. The net
charge-off ratio reached another multi-year low of 0.26% for
2015, down eight basis points compared to 2014. Going into
2016, we expect NPLs and net charge-offs to increase, primarily
as a result of further stress amongst our energy clients, but also
due to normalization from the overall low levels of net charge-
offs and NPLs we had in 2015. However, we expect our overall
net charge-off ratio to be between 30 and 40 basis points in 2016,
which is below our long-term expectation of 40 to 70 basis points.
See additional discussion of credit and asset quality in the
“Loans,” “Allowance for Credit Losses,” and “Nonperforming
Assets” sections of this MD&A.
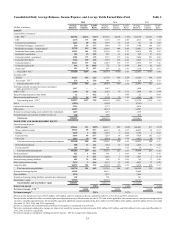
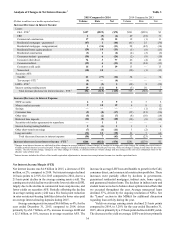
During 2015, our average loans increased $2.7 billion, or
2%, compared to the prior year, driven primarily by growth in
our C&I and consumer direct portfolios, partially offset by
declines in our government-guaranteed residential mortgage,
residential home equity, and consumer indirect portfolios. The
momentum in our consumer direct portfolio continues to be
strong, driven by our online and third-party origination channels,
and increased success with our credit card offering. The
reduction in consumer indirect loans was driven in large part by
the second quarter of 2015 securitization of $1.0 billion of
indirect auto loans. Since the middle of 2014, we have sold or
securitized approximately $5 billion of loans from various
portfolios. Going forward, we expect to periodically sell or
securitize lower-return loans as part of our balance sheet
optimization focus. We have built positive and broad-based
momentum across our lending platforms and are focused on
continuing to generate targeted loan growth at accretive risk-
adjusted returns. See additional loan discussion in the “Loans,”
“Nonperforming Assets,” and "Net Interest Income/Margin"
sections of this MD&A.
Average consumer and commercial deposits increased 9%
during 2015, driven by strong and broad-based growth in lower
cost deposits across most of our business segments, partially
offset by gradual declines in higher-cost time deposits. Our
success growing deposits during 2015 reflects our overall
strategic focus on meeting more clients’ deposit and payment
needs, supplemented by investments in technology platforms
and client-facing bankers. Our strong deposit growth directly
enabled us to support our lending platform and reduce higher-
cost long-term debt by $4.6 billion, or 35%, over the past year.
Importantly, the strong deposit growth we have delivered has not
resulted in adverse changes in rates paid or deposit mix. If interest
rates begin to rise, some of these trends may change; however,
we will maintain a disciplined approach to pricing with a focus
on maximizing our value proposition for clients. See additional
discussion on our deposits in the "Net Interest Income/Margin"
and "Deposits" sections of this MD&A.
Capital and Liquidity
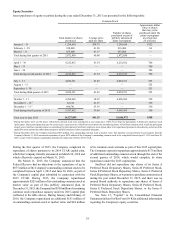
During 2015, we repurchased approximately $680 million of our
outstanding common stock at market value, which included $115
million under our 2014 capital plan, $525 million under our 2015
capital plan, and a $39 million incremental repurchase in
December 2015, which was separate from our 2014 and 2015
capital plans. During January and February of 2016, we
repurchased an additional $151 million of our outstanding
common stock and $24 million of our common stock warrants
as part of the 2015 capital plan. We currently expect to repurchase
approximately $175 million of additional outstanding common
stock through the end of the second quarter of 2016, which would
complete our share repurchases under our 2015 capital plan. See
additional details related to our capital actions in the “Capital
Resources” section of this MD&A.
Our book value and tangible book value per common share
increased 5% and 6%, respectively, compared to the prior year
due primarily to growth in retained earnings and a lower share
count. Additionally, we increased our quarterly common stock
dividend by 20% beginning in the second quarter of 2015, which
resulted in dividends for 2015 of $0.92 per common share, an
increase from $0.70 per common share in 2014. See additional
details related to our capital actions in the “Capital Resources”
section of this MD&A and in Note 13, "Capital," to the
Consolidated Financial Statements in this Form 10-K. Also see
Table 1, "Selected Financial Data and Reconcilement of Non-
U.S. GAAP Measures," in this MD&A for additional information
regarding, and a reconciliation of, tangible book value per
common share.
Our regulatory capital position remained strong during the
year, with a CET1 ratio of 9.96% at December 31, 2015.
Additionally, our estimated CET1 ratio at December 31, 2015,
on a fully phased-in basis, was 9.80%, which is well above the
current regulatory requirement. See Table 1, "Selected Financial
Data and Reconcilement of Non-U.S. GAAP Measures" in this
MD&A for a reconciliation of our transitional CET1 ratio to our
fully phased-in, estimated CET1 ratio.
Separately, our LCR at December 31, 2015 continued to
exceed the January 1, 2016 requirement of 90%, for which we
are now formally required to be in compliance. The cumulative
actions we have taken to improve our risk and earnings profile,
combined with our strong capital and liquidity levels, should
help us to further increase capital returns to shareholders. See
additional discussion of our capital and liquidity position in the
"Capital Resources" and "Liquidity Risk Management" sections
of this MD&A. See additional discussion of our capital and
liquidity position in the "Capital Resources" and "Liquidity Risk
Management" sections of this MD&A.