SunTrust 2015 Annual Report Download - page 117
Download and view the complete annual report
Please find page 117 of the 2015 SunTrust annual report below. You can navigate through the pages in the report by either clicking on the pages listed below, or by using the keyword search tool below to find specific information within the annual report.-
 1
1 -
2
-
3
-
4
-
5
-
6
-
7
-
8
-
9
-
10
-
11
-
12
-
13
-
14
-
15
-
16
-
17
-
18
-
19
-
20
-
21
-
22
-
23
-
24
-
25
-
26
-
27
-
28
-
29
-
30
-
31
-
32
-
33
-
34
-
35
-
36
-
37
-
38
-
39
-
40
-
41
-
42
-
43
-
44
-
45
-
46
-
47
-
48
-
49
-
50
-
51
-
52
-
53
-
54
-
55
-
56
-
57
-
58
-
59
-
60
-
61
-
62
-
63
-
64
-
65
-
66
-
67
-
68
-
69
-
70
-
71
-
72
-
73
-
74
-
75
-
76
-
77
-
78
-
79
-
80
-
81
-
82
-
83
-
84
-
85
-
86
-
87
-
88
-
89
-
90
-
91
-
92
-
93
-
94
-
95
-
96
-
97
-
98
-
99
-
100
-
101
-
102
-
103
-
104
-
105
-
106
-
 107
107 -
 108
108 -
 109
109 -
 110
110 -
 111
111 -
 112
112 -
 113
113 -
 114
114 -
 115
115 -
 116
116 -
 117
117 -
 118
118 -
 119
119 -
 120
120 -
 121
121 -
 122
122 -
 123
123 -
 124
124 -
 125
125 -
 126
126 -
 127
127 -
128
-
129
-
130
-
131
-
132
-
133
-
134
-
135
-
136
-
137
-
138
-
139
-
140
-
141
-
142
-
143
-
144
-
145
-
146
-
147
-
148
-
149
-
150
-
151
-
152
-
153
-
154
-
155
-
156
-
157
-
158
-
159
-
160
-
161
-
162
-
163
-
164
-
165
-
166
-
167
-
168
-
169
-
170
-
171
-
172
-
173
-
174
-
175
-
176
-
177
-
178
-
179
-
180
-
181
-
182
-
183
-
184
-
185
-
186
-
187
-
188
-
189
-
190
-
191
-
192
-
193
-
194
-
195
-
196
 |
 |
Notes to Consolidated Financial Statements, continued
89
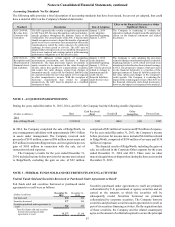
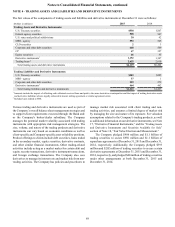
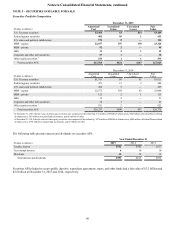
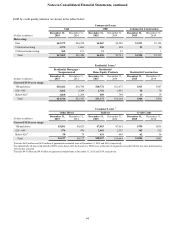
NOTE 4 - TRADING ASSETS AND LIABILITIES AND DERIVATIVE INSTRUMENTS
The fair values of the components of trading assets and liabilities and derivative instruments at December 31 were as follows:
(Dollars in millions) 2015 2014
Trading Assets and Derivative Instruments:
U.S. Treasury securities $538 $267
Federal agency securities 588 547
U.S. states and political subdivisions 30 42
MBS - agency 553 545
CLO securities 23
Corporate and other debt securities 468 509
CP 67 327
Equity securities 66 45
Derivative instruments 11,152 1,307
Trading loans 22,655 2,610
Total trading assets and derivative instruments $6,119 $6,202
Trading Liabilities and Derivative Instruments:
U.S. Treasury securities $503 $485
MBS - agency 37 1
Corporate and other debt securities 259 279
Derivative instruments 1464 462
Total trading liabilities and derivative instruments $1,263 $1,227
1 Amounts include the impact of offsetting cash collateral received from and paid to the same derivative counterparties and the impact of netting derivative assets
and derivative liabilities when a legally enforceable master netting agreement or similar agreement exists.
2 Includes loans related to TRS.
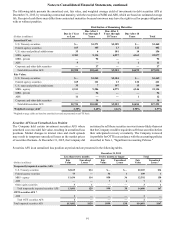
Various trading and derivative instruments are used as part of
the Company’s overall balance sheet management strategies and
to support client requirements executed through the Bank and/
or the Company's broker/dealer subsidiary. The Company
manages the potential market volatility associated with trading
instruments with appropriate risk management strategies. The
size, volume, and nature of the trading products and derivative
instruments can vary based on economic conditions as well as
client-specific and Company-specific asset or liability positions.
Product offerings to clients include debt securities, loans traded
in the secondary market, equity securities, derivative contracts,
and other similar financial instruments. Other trading-related
activities include acting as a market maker for certain debt and
equity security transactions, derivative instrument transactions,
and foreign exchange transactions. The Company also uses
derivatives to manage its interest rate and market risk from non-
trading activities. The Company has policies and procedures to
manage market risk associated with client trading and non-
trading activities, and assumes a limited degree of market risk
by managing the size and nature of its exposure. For valuation
assumptions related to the Company's trading products, as well
as additional information on our derivative instruments, see Note
17, “Derivative Financial Instruments,” and the “Trading Assets
and Derivative Instruments and Securities Available for Sale”
section of Note 18, “Fair Value Election and Measurement.”
The Company pledged $986 million and $1.1 billion of
trading securities to secure $950 million and $1.1 billion of
repurchase agreements at December 31, 2015 and December 31,
2014, respectively. Additionally, the Company pledged $393
million and $202 million of trading securities to secure certain
derivative agreements at December 31, 2015 and December 31,
2014, respectively, and pledged $40 million of trading securities
under other arrangements at both December 31, 2015 and
December 31, 2014.