SunTrust 2015 Annual Report Download - page 181
Download and view the complete annual report
Please find page 181 of the 2015 SunTrust annual report below. You can navigate through the pages in the report by either clicking on the pages listed below, or by using the keyword search tool below to find specific information within the annual report.-
 1
1 -
2
-
3
-
4
-
5
-
6
-
7
-
8
-
9
-
10
-
11
-
12
-
13
-
14
-
15
-
16
-
17
-
18
-
19
-
20
-
21
-
22
-
23
-
24
-
25
-
26
-
27
-
28
-
29
-
30
-
31
-
32
-
33
-
34
-
35
-
36
-
37
-
38
-
39
-
40
-
41
-
42
-
43
-
44
-
45
-
46
-
47
-
48
-
49
-
50
-
51
-
52
-
53
-
54
-
55
-
56
-
57
-
58
-
59
-
60
-
61
-
62
-
63
-
64
-
65
-
66
-
67
-
68
-
69
-
70
-
71
-
72
-
73
-
74
-
75
-
76
-
77
-
78
-
79
-
80
-
81
-
82
-
83
-
84
-
85
-
86
-
87
-
88
-
89
-
90
-
91
-
92
-
93
-
94
-
95
-
96
-
97
-
98
-
99
-
100
-
101
-
102
-
103
-
104
-
105
-
106
-
107
-
108
-
109
-
110
-
111
-
112
-
113
-
114
-
115
-
116
-
117
-
118
-
119
-
120
-
121
-
122
-
123
-
124
-
125
-
126
-
127
-
128
-
129
-
130
-
131
-
132
-
133
-
134
-
135
-
136
-
137
-
138
-
139
-
140
-
141
-
142
-
143
-
144
-
145
-
146
-
147
-
148
-
149
-
150
-
151
-
152
-
153
-
154
-
155
-
156
-
157
-
158
-
159
-
160
-
161
-
162
-
163
-
164
-
165
-
166
-
167
-
168
-
169
-
170
-
 171
171 -
 172
172 -
 173
173 -
 174
174 -
 175
175 -
 176
176 -
 177
177 -
 178
178 -
 179
179 -
 180
180 -
 181
181 -
 182
182 -
 183
183 -
 184
184 -
 185
185 -
 186
186 -
 187
187 -
 188
188 -
 189
189 -
 190
190 -
 191
191 -
192
-
193
-
194
-
195
-
196
 |
 |

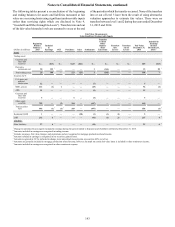
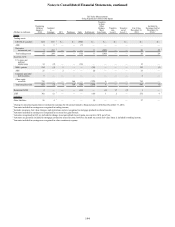
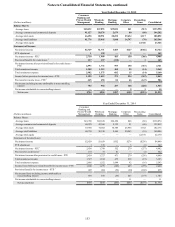
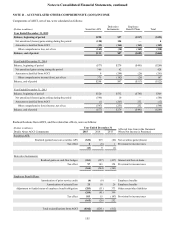
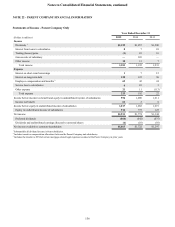
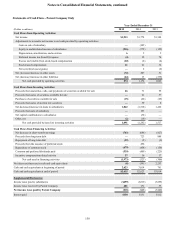
Notes to Consolidated Financial Statements, continued
153
Year Ended December 31, 2015
(Dollars in millions)
Consumer
Banking and
Private Wealth
Management
Wholesale
Banking
Mortgage
Banking
Corporate
Other
Reconciling
Items Consolidated
Balance Sheets:
Average loans $40,632 $67,853 $25,024 $61 ($12) $133,558
Average consumer and commercial deposits 91,127 50,376 2,679 80 (60) 144,202
Average total assets 46,498 80,951 28,692 29,634 3,117 188,892
Average total liabilities 91,776 55,995 3,048 14,797 (70) 165,546
Average total equity — — — — 23,346 23,346
Statements of Income:
Net interest income $2,729 $1,771 $483 $147 ($366) $4,764
FTE adjustment 1 138 — 3 — 142
Net interest income - FTE 12,730 1,909 483 150 (366) 4,906
Provision/(benefit) for credit losses 2137 137 (110) — 1 165
Net interest income after provision/(benefit) for credit losses -
FTE 2,593 1,772 593 150 (367) 4,741
Total noninterest income 1,508 1,215 460 99 (14) 3,268
Total noninterest expense 2,902 1,575 682 15 (14) 5,160
Income before provision for income taxes - FTE 1,199 1,412 371 234 (367) 2,849
Provision for income taxes - FTE 3445 458 84 66 (147) 906
Net income including income attributable to noncontrolling
interest 754 954 287 168 (220) 1,943
Net income attributable to noncontrolling interest — — — 9 1 10
Net income $754 $954 $287 $159 ($221) $1,933
Year Ended December 31, 2014
(Dollars in millions)
Consumer
Banking and
Private Wealth
Management
Wholesale
Banking
Mortgage
Banking
Corporate
Other
Reconciling
Items Consolidated
Balance Sheets:
Average loans $41,700 $62,638 $26,494 $48 ($6) $130,874
Average consumer and commercial deposits 86,070 43,566 2,333 91 (48) 132,012
Average total assets 47,380 74,302 30,386 26,966 3,142 182,176
Average total liabilities 86,798 50,310 2,665 20,243 (10) 160,006
Average total equity — — — — 22,170 22,170
Statements of Income/(Loss):
Net interest income $2,629 $1,659 $552 $276 ($276) $4,840
FTE adjustment 1 139 — 3 (1) 142
Net interest income - FTE 12,630 1,798 552 279 (277) 4,982
Provision for credit losses 2191 71 81 — (1) 342
Net interest income after provision for credit losses - FTE 2,439 1,727 471 279 (276) 4,640
Total noninterest income 1,527 1,104 473 238 (19) 3,323
Total noninterest expense 2,866 1,552 1,049 92 (16) 5,543
Income/(loss) before provision/(benefit) for income taxes - FTE 1,100 1,279 (105) 425 (279) 2,420
Provision/(benefit) for income taxes - FTE 3405 404 (52) (20) (102) 635
Net income/(loss) including income attributable to
noncontrolling interest 695 875 (53) 445 (177) 1,785
Net income attributable to noncontrolling interest — — — 11 — 11
Net income/(loss) $695 $875 ($53) $434 ($177) $1,774