SunTrust 2015 Annual Report Download - page 65
Download and view the complete annual report
Please find page 65 of the 2015 SunTrust annual report below. You can navigate through the pages in the report by either clicking on the pages listed below, or by using the keyword search tool below to find specific information within the annual report.-
 1
1 -
2
-
3
-
4
-
5
-
6
-
7
-
8
-
9
-
10
-
11
-
12
-
13
-
14
-
15
-
16
-
17
-
18
-
19
-
20
-
21
-
22
-
23
-
24
-
25
-
26
-
27
-
28
-
29
-
30
-
31
-
32
-
33
-
34
-
35
-
36
-
37
-
38
-
39
-
40
-
41
-
42
-
43
-
44
-
45
-
46
-
47
-
48
-
49
-
50
-
51
-
52
-
53
-
54
-
 55
55 -
 56
56 -
 57
57 -
 58
58 -
 59
59 -
 60
60 -
 61
61 -
 62
62 -
 63
63 -
 64
64 -
 65
65 -
 66
66 -
 67
67 -
 68
68 -
 69
69 -
 70
70 -
 71
71 -
 72
72 -
 73
73 -
 74
74 -
 75
75 -
76
-
77
-
78
-
79
-
80
-
81
-
82
-
83
-
84
-
85
-
86
-
87
-
88
-
89
-
90
-
91
-
92
-
93
-
94
-
95
-
96
-
97
-
98
-
99
-
100
-
101
-
102
-
103
-
104
-
105
-
106
-
107
-
108
-
109
-
110
-
111
-
112
-
113
-
114
-
115
-
116
-
117
-
118
-
119
-
120
-
121
-
122
-
123
-
124
-
125
-
126
-
127
-
128
-
129
-
130
-
131
-
132
-
133
-
134
-
135
-
136
-
137
-
138
-
139
-
140
-
141
-
142
-
143
-
144
-
145
-
146
-
147
-
148
-
149
-
150
-
151
-
152
-
153
-
154
-
155
-
156
-
157
-
158
-
159
-
160
-
161
-
162
-
163
-
164
-
165
-
166
-
167
-
168
-
169
-
170
-
171
-
172
-
173
-
174
-
175
-
176
-
177
-
178
-
179
-
180
-
181
-
182
-
183
-
184
-
185
-
186
-
187
-
188
-
189
-
190
-
191
-
192
-
193
-
194
-
195
-
196
 |
 |

37
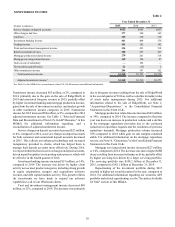
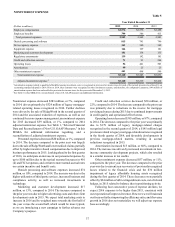
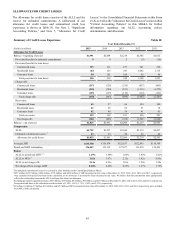
NONINTEREST EXPENSE
Table 5
Year Ended December 31
(Dollars in millions) 2015 2014 2013
Employee compensation $2,576 $2,576 $2,488
Employee benefits 366 386 413
Total personnel expenses 2,942 2,962 2,901
Outside processing and software 815 741 746
Net occupancy expense 341 340 348
Equipment expense 164 169 181
Marketing and customer development 151 134 135
Regulatory assessments 139 142 181
Credit and collection services 71 91 264
Operating losses 56 441 503
Amortization 40 25 23
Other noninterest expense 1441 498 549
Total noninterest expense $5,160 $5,543 $5,831
Adjusted noninterest expense 2$5,160 $5,219 $5,412
1 Amortization expense related to qualified affordable housing investment costs is recognized in provision for income taxes for each of the periods presented as allowed by an
accounting standard adopted in 2014. Prior to 2014, these amounts were recognized in other noninterest expense, and therefore, for comparative purposes, $49 million of
amortization expense has been reclassified to provision for income taxes for the year ended December 31, 2013.
2 See Table 1 in this MD&A for a reconcilement of non-U.S. GAAP measures and additional information.
Noninterest expense decreased $383 million, or 7%, compared
to 2014, driven primarily by $324 million of legacy mortgage-
related operating losses recognized in 2014. Further declines
were driven by the sale of RidgeWorth in the second quarter of
2014 and the associated reduction of expenses, as well as our
continued focus on expense management, as noninterest expense
for 2015 decreased $59 million, or 1%, compared to 2014
adjusted noninterest expense. See Table 1, "Selected Financial
Data and Reconcilement of Non-U.S. GAAP Measures," in this
MD&A for additional information regarding, and a
reconciliation of, adjusted noninterest expense.
Personnel expenses decreased $20 million, or 1%, compared
to 2014. The decrease compared to the prior year was largely
due to the sale of RidgeWorth and lower medical claims, partially
offset by higher incentive-based compensation due to improved
business performance in 2015. Looking ahead to the first quarter
of 2016, we anticipate an increase in our personnel expenses by
up to $100 million due to the typical seasonal increases in 401
(k) and FICA expenses, and a return to more normal accrual rates
on certain incentive and benefit costs.
Outside processing and software expenses increased $74
million, or 10%, compared to 2014. The increase was due to the
higher utilization of third party services, increased business and
compliance activity, as well as increased investments in
technology.
Marketing and customer development increased $17
million, or 13%, compared to 2014. The increase compared to
the prior year was due to higher advertising costs and other client
development costs in 2015. We expect total marketing costs to
increase in 2016 and be weighted more towards the first half of
the year versus the second half, which would be more typical,
as we are introducing a new campaign to further advance our
Company’s purpose.
Credit and collection services decreased $20 million, or
22%, compared to 2014. The decrease compared to the prior year
was primarily due to reductions in the reserve for mortgage
servicing advances during 2015 due to continued improvements
in credit quality and operational effectiveness.
Operating losses decreased $385 million, or 87%, compared
to 2014. The decrease compared to the prior year was primarily
due to $179 million of legacy mortgage-related charges
recognized in the second quarter of 2014, a $145 million legal
provision related to legacy mortgage-related matters recognized
in the fourth quarter of 2014, and favorable developments in
previous mortgage-related matters, resulting in accrual
reductions recognized in 2015.
Amortization increased $15 million, or 60%, compared to
2014. The increase was driven by increased investments in low-
income community development projects, which also resulted
in a similar increase in tax credits.
Other noninterest expense decreased $57 million, or 11%,
compared to the prior year. The decrease compared to the prior
year was due to current year recoveries of previously recognized
losses related to the financial crisis and the $36 million
impairment of legacy affordable housing assets recognized
during the first quarter of 2014. These decreases were partially
offset by $24 million of debt extinguishment costs, net of related
hedges, in 2015 related to balance sheet repositioning activity.
Following four consecutive years of expense declines, we
expect 2016 expenses to be higher than 2015, consistent with
our expectation of improved revenue. However, we will maintain
our focus on further improving the efficiency ratio, and if revenue
growth in 2016 does not materialize we will adjust our expense
base accordingly.