SunTrust 2015 Annual Report Download - page 59
Download and view the complete annual report
Please find page 59 of the 2015 SunTrust annual report below. You can navigate through the pages in the report by either clicking on the pages listed below, or by using the keyword search tool below to find specific information within the annual report.-
 1
1 -
2
-
3
-
4
-
5
-
6
-
7
-
8
-
9
-
10
-
11
-
12
-
13
-
14
-
15
-
16
-
17
-
18
-
19
-
20
-
21
-
22
-
23
-
24
-
25
-
26
-
27
-
28
-
29
-
30
-
31
-
32
-
33
-
34
-
35
-
36
-
37
-
38
-
39
-
40
-
41
-
42
-
43
-
44
-
45
-
46
-
47
-
48
-
 49
49 -
 50
50 -
 51
51 -
 52
52 -
 53
53 -
 54
54 -
 55
55 -
 56
56 -
 57
57 -
 58
58 -
 59
59 -
 60
60 -
 61
61 -
 62
62 -
 63
63 -
 64
64 -
 65
65 -
 66
66 -
 67
67 -
 68
68 -
 69
69 -
70
-
71
-
72
-
73
-
74
-
75
-
76
-
77
-
78
-
79
-
80
-
81
-
82
-
83
-
84
-
85
-
86
-
87
-
88
-
89
-
90
-
91
-
92
-
93
-
94
-
95
-
96
-
97
-
98
-
99
-
100
-
101
-
102
-
103
-
104
-
105
-
106
-
107
-
108
-
109
-
110
-
111
-
112
-
113
-
114
-
115
-
116
-
117
-
118
-
119
-
120
-
121
-
122
-
123
-
124
-
125
-
126
-
127
-
128
-
129
-
130
-
131
-
132
-
133
-
134
-
135
-
136
-
137
-
138
-
139
-
140
-
141
-
142
-
143
-
144
-
145
-
146
-
147
-
148
-
149
-
150
-
151
-
152
-
153
-
154
-
155
-
156
-
157
-
158
-
159
-
160
-
161
-
162
-
163
-
164
-
165
-
166
-
167
-
168
-
169
-
170
-
171
-
172
-
173
-
174
-
175
-
176
-
177
-
178
-
179
-
180
-
181
-
182
-
183
-
184
-
185
-
186
-
187
-
188
-
189
-
190
-
191
-
192
-
193
-
194
-
195
-
196
 |
 |

31
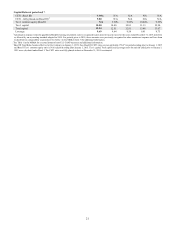
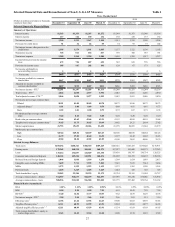
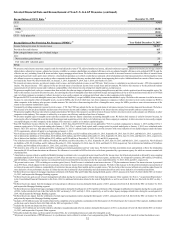
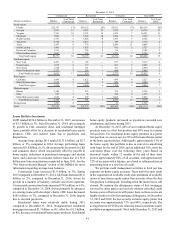
Selected Financial Data and Reconcilement of Non-U.S. GAAP Measures (continued)
Year Ended December 31
(Dollars in millions, except per share data) 2014 2013
Reconcilement of Non-U.S. GAAP Measures - Annual
(continued)
As
Reported Adjustments
As
Adjusted 1 As
Reported Adjustments
As
Adjusted 1
Net interest income $4,840 $— $4,840 $4,853 $— $4,853
Provision for credit losses 342 — 342 553 — 553
Net interest income after provision for credit losses 4,498 — 4,498 4,300 — 4,300
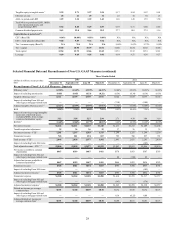
Noninterest Income
Service charges on deposit accounts 645 — 645 657 — 657
Other charges and fees 368 — 368 369 — 369
Card fees 320 — 320 310 — 310
Investment banking income 404 — 404 356 — 356
Trading income 182 — 182 182 — 182
Trust and investment management income 423 — 423 518 — 518
Retail investment services 297 — 297 267 — 267
Mortgage production related income 201 — 201 314 63 14 377
Mortgage servicing related income 196 — 196 87 — 87
Gain on sale of subsidiary 105 (105) 15 — — — —
Net securities (losses)/gains (15) — (15) 2 — 2
Other noninterest income 197 — 197 152 — 152
Total noninterest income 3,323 (105) 3,218 3,214 63 3,277
Noninterest Expense
Employee compensation 2,576 — 2,576 2,488 — 2,488
Employee benefits 386 — 386 413 — 413
Outside processing and software 741 — 741 746 — 746
Net occupancy expense 340 — 340 348 — 348
Equipment expense 169 — 169 181 — 181
Regulatory assessments 142 — 142 181 — 181
Marketing and customer development 134 — 134 135 — 135
Credit and collection services 91 — 91 264 (96) 16 168
Operating losses 441 (324) 17 117 503 (323) 18 180
Amortization 25 — 25 23 — 23
Other noninterest expense 498 — 498 549 — 549
Total noninterest expense 5,543 (324) 5,219 5,831 (419) 5,412
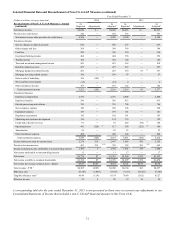
Income before provision for income taxes 2,278 219 2,497 1,683 482 2,165
Provision for income taxes 493 212 19,20 705 322 303 20,21 625
Income including income attributable to noncontrolling interest 1,785 7 1,792 1,361 179 1,540
Net income attributable to noncontrolling interest 11 — 11 17 — 17
Net income $1,774 $7 $1,781 $1,344 $179 $1,523
Net income available to common shareholders $1,722 $7 $1,729 $1,297 $179 $1,476
Net income per average common share - diluted $3.23 $0.01 $3.24 $2.41 $0.33 $2.74
Total revenue - FTE 2$8,305 ($105) $8,200 $8,194 $63 $8,257
Efficiency ratio 566.74% (3.09)% 63.65% 71.16% (5.62)% 65.54%
Tangible efficiency ratio 666.44 (3.10) 63.34 70.89 (5.62) 65.27
Effective tax rate 22 6 28 19 10 29
A corresponding table for the year ended December 31, 2015 is not presented as there were no current year adjustments to our
Consolidated Statements of Income that included a non-U.S.GAAP financial measure in this Form 10-K.