SunTrust 2015 Annual Report Download - page 138
Download and view the complete annual report
Please find page 138 of the 2015 SunTrust annual report below. You can navigate through the pages in the report by either clicking on the pages listed below, or by using the keyword search tool below to find specific information within the annual report.-
 1
1 -
2
-
3
-
4
-
5
-
6
-
7
-
8
-
9
-
10
-
11
-
12
-
13
-
14
-
15
-
16
-
17
-
18
-
19
-
20
-
21
-
22
-
23
-
24
-
25
-
26
-
27
-
28
-
29
-
30
-
31
-
32
-
33
-
34
-
35
-
36
-
37
-
38
-
39
-
40
-
41
-
42
-
43
-
44
-
45
-
46
-
47
-
48
-
49
-
50
-
51
-
52
-
53
-
54
-
55
-
56
-
57
-
58
-
59
-
60
-
61
-
62
-
63
-
64
-
65
-
66
-
67
-
68
-
69
-
70
-
71
-
72
-
73
-
74
-
75
-
76
-
77
-
78
-
79
-
80
-
81
-
82
-
83
-
84
-
85
-
86
-
87
-
88
-
89
-
90
-
91
-
92
-
93
-
94
-
95
-
96
-
97
-
98
-
99
-
100
-
101
-
102
-
103
-
104
-
105
-
106
-
107
-
108
-
109
-
110
-
111
-
112
-
113
-
114
-
115
-
116
-
117
-
118
-
119
-
120
-
121
-
122
-
123
-
124
-
125
-
126
-
127
-
 128
128 -
 129
129 -
 130
130 -
 131
131 -
 132
132 -
 133
133 -
 134
134 -
 135
135 -
 136
136 -
 137
137 -
 138
138 -
 139
139 -
 140
140 -
 141
141 -
 142
142 -
 143
143 -
 144
144 -
 145
145 -
 146
146 -
 147
147 -
 148
148 -
149
-
150
-
151
-
152
-
153
-
154
-
155
-
156
-
157
-
158
-
159
-
160
-
161
-
162
-
163
-
164
-
165
-
166
-
167
-
168
-
169
-
170
-
171
-
172
-
173
-
174
-
175
-
176
-
177
-
178
-
179
-
180
-
181
-
182
-
183
-
184
-
185
-
186
-
187
-
188
-
189
-
190
-
191
-
192
-
193
-
194
-
195
-
196
 |
 |

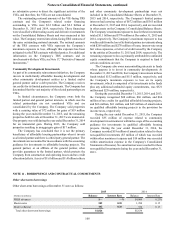
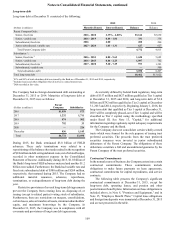
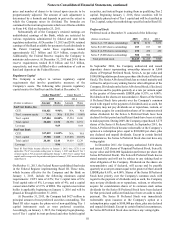
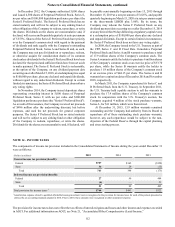
Notes to Consolidated Financial Statements, continued
110
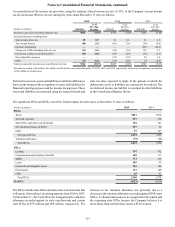
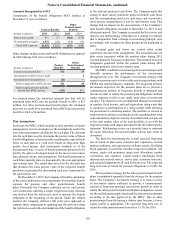
Payments Due by Period
(Dollars in millions) 2016 2017 2018 2019 2020 Thereafter Total
Purchase obligations 1$349 $17 $13 $4 $— $— $383
Consumer and other time deposits 2, 3 4,736 1,933 1,317 575 876 382 9,819
Brokered time deposits 3196 83 104 181 212 123 899
1 Amounts represent termination fees for legally binding purchase obligations of $5 million or more. Payments made towards the purchase of goods or services under these
contracts totaled $243 million, $223 million, and $194 million in 2015, 2014, and 2013, respectively.
2 The aggregate amount of time deposit accounts in denominations of $250,000 or more totaled $1.4 billion at both December 31, 2015 and 2014, respectively.
3 Amounts do not include interest.
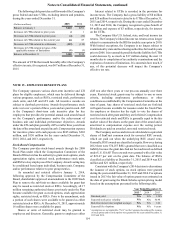
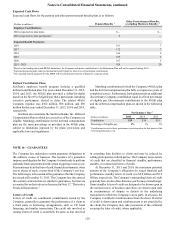
NOTE 12 – NET INCOME PER COMMON SHARE
Equivalent shares of 14 million, 15 million, and 18 million
related to common stock options and common stock warrants
outstanding at December 31, 2015, 2014, and 2013, respectively,
were excluded from the computations of diluted net income per
average common share because they would have been anti-
dilutive.
Reconciliations of net income to net income available to
common shareholders and the difference between average basic
common shares outstanding and average diluted common shares
outstanding are presented below.
Year Ended December 31
(Dollars and shares in millions, except per share data) 2015 2014 2013
Net income $1,933 $1,774 $1,344
Preferred dividends (64) (42) (37)
Dividends and undistributed earnings allocated to unvested shares (6) (10) (10)
Net income available to common shareholders $1,863 $1,722 $1,297
Average basic common shares 515 528 534
Effect of dilutive securities:
Stock options 21 1
Restricted stock, RSUs, and warrants 44 4
Average diluted common shares 521 533 539
Net income per average common share - diluted $3.58 $3.23 $2.41
Net income per average common share - basic $3.62 $3.26 $2.43
NOTE 13 – CAPITAL
During 2015, pursuant to the Federal Reserve's non-objection to
the Company's capital plan in conjunction with the 2015 CCAR,
the Company increased its quarterly common stock dividend
from $0.20 to $0.24 per share beginning in the second quarter
of 2015, maintained dividend payments on its preferred stock,
and repurchased $525 million of its outstanding common stock
at market value (approximately 12.7 million shares) under the
2015 plan. During the first quarter of 2015, the Company also
repurchased $115 million of its outstanding common stock at
market value, which completed the repurchase of shares pursuant
to its 2014 CCAR capital plan, which effectively expired on
March 31, 2015. At December 31, 2015, the Company had
capacity under its 2015 capital plan to purchase an additional
$350 million of its outstanding common stock through June 30,
2016. In December 2015, the Company repurchased an
additional $39 million of its outstanding common stock at market
value, which was incremental to and separate from the existing
availability under the 2015 CCAR capital plan.
During the years ended December 31, 2015, 2014, and 2013,
the Company declared and paid common dividends of $475
million, or $0.92 per common share, $371 million, or $0.70 per
common share, and $188 million, or $0.35 per common share,
respectively. The Company also recognized dividends on
perpetual preferred stock of $64 million, $42 million, and $37
million during the years ended December 31, 2015, 2014, and
2013, respectively. During 2015, both the Series A and Series B
Perpetual Preferred Stock dividend was $4,056 per share, the
Series E Perpetual Preferred Stock dividend was $5,875 per
share, and the Series F Perpetual Preferred Stock dividend was
$6,219 per share.
The Company remains subject to certain restrictions on its
ability to increase the dividend on common shares as a result of
participating in the U.S. Treasury’s CPP. If the Company
increases its dividend above $0.54 per share per quarter prior to
the tenth anniversary of its participation in the CPP, then the anti-
dilution provision within the warrants issued in connection with
the Company’s participation in the CPP will require the exercise