SunTrust 2015 Annual Report Download - page 133
Download and view the complete annual report
Please find page 133 of the 2015 SunTrust annual report below. You can navigate through the pages in the report by either clicking on the pages listed below, or by using the keyword search tool below to find specific information within the annual report.-
 1
1 -
2
-
3
-
4
-
5
-
6
-
7
-
8
-
9
-
10
-
11
-
12
-
13
-
14
-
15
-
16
-
17
-
18
-
19
-
20
-
21
-
22
-
23
-
24
-
25
-
26
-
27
-
28
-
29
-
30
-
31
-
32
-
33
-
34
-
35
-
36
-
37
-
38
-
39
-
40
-
41
-
42
-
43
-
44
-
45
-
46
-
47
-
48
-
49
-
50
-
51
-
52
-
53
-
54
-
55
-
56
-
57
-
58
-
59
-
60
-
61
-
62
-
63
-
64
-
65
-
66
-
67
-
68
-
69
-
70
-
71
-
72
-
73
-
74
-
75
-
76
-
77
-
78
-
79
-
80
-
81
-
82
-
83
-
84
-
85
-
86
-
87
-
88
-
89
-
90
-
91
-
92
-
93
-
94
-
95
-
96
-
97
-
98
-
99
-
100
-
101
-
102
-
103
-
104
-
105
-
106
-
107
-
108
-
109
-
110
-
111
-
112
-
113
-
114
-
115
-
116
-
117
-
118
-
119
-
120
-
121
-
122
-
 123
123 -
 124
124 -
 125
125 -
 126
126 -
 127
127 -
 128
128 -
 129
129 -
 130
130 -
 131
131 -
 132
132 -
 133
133 -
 134
134 -
 135
135 -
 136
136 -
 137
137 -
 138
138 -
 139
139 -
 140
140 -
 141
141 -
 142
142 -
 143
143 -
144
-
145
-
146
-
147
-
148
-
149
-
150
-
151
-
152
-
153
-
154
-
155
-
156
-
157
-
158
-
159
-
160
-
161
-
162
-
163
-
164
-
165
-
166
-
167
-
168
-
169
-
170
-
171
-
172
-
173
-
174
-
175
-
176
-
177
-
178
-
179
-
180
-
181
-
182
-
183
-
184
-
185
-
186
-
187
-
188
-
189
-
190
-
191
-
192
-
193
-
194
-
195
-
196
 |
 |

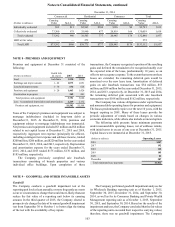
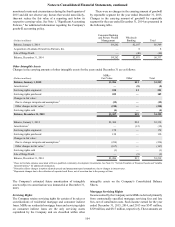
Notes to Consolidated Financial Statements, continued
105
reported in mortgage servicing related income in the
Consolidated Statements of Income.
At December 31, 2015 and 2014, the total UPB of mortgage
loans serviced was $148.2 billion and $142.1 billion,
respectively. Included in these amounts were $121.0 billion and
$115.5 billion at December 31, 2015 and 2014, respectively, of
loans serviced for third parties. The Company purchased MSRs
on residential loans with a UPB of $10.3 billion during the year
ended December 31, 2015, all of which are reflected in the UPB
amounts above. The Company purchased MSRs on residential
loans with a UPB of $10.9 billion during the year ended
December 31, 2014. During the years ended December 31, 2015
and 2014, the Company sold MSRs on residential loans, at a
price approximating their fair value, with a UPB of $803 million
and $878 million, respectively.
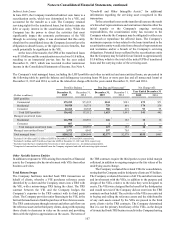
The Company calculates the fair value of MSRs using a
valuation model that calculates the present value of estimated
future net servicing income using prepayment projections,
spreads, and other assumptions. Senior management and the
STM Valuation Committee review all significant assumptions at
least quarterly, comparing these inputs to various sources of
market data. Changes to valuation model inputs are reflected in
the periods' results. See Note 18, “Fair Value Election and
Measurement,” for further information regarding the Company's
MSR valuation methodology.
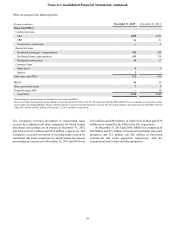
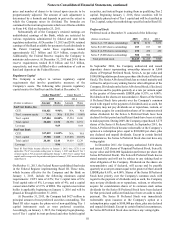
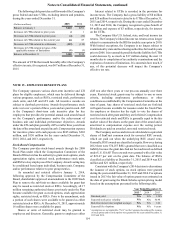
A summary of the key inputs used to estimate the fair value
of the Company’s MSRs at December 31, 2015 and 2014, and
the sensitivity of the fair values to immediate 10% and 20%
adverse changes in those inputs, are presented in the following
table.
(Dollars in millions)
December 31,
2015
December 31,
2014
Fair value of MSRs $1,307 $1,206
Prepayment rate assumption (annual) 10% 11%
Decline in fair value from 10%
adverse change $49 $46
Decline in fair value from 20%
adverse change 94 88
Option adjusted spread (annual) 8% 10%
Decline in fair value from 10%
adverse change $64 $55
Decline in fair value from 20%
adverse change 123 105
Weighted-average life (in years) 6.6 6.4
Weighted-average coupon 4.1% 4.2%
These MSR sensitivities are hypothetical and should be used
with caution. Changes in fair value based on variations in
assumptions generally cannot be extrapolated because (i) the
relationship of the change in an assumption to the change in fair
value may not be linear and (ii) changes in one assumption may
result in changes in another, which might magnify or counteract
the sensitivities. The sensitivities do not reflect the effect of
hedging activity undertaken by the Company to offset changes
in the fair value of MSRs. See Note 17, “Derivative Financial
Instruments,” for further information regarding these hedging
activities.
Consumer Loan Servicing Rights
In June 2015, the Company completed the securitization of $1.0
billion of indirect auto loans, with servicing rights retained, and
recognized a $13 million servicing asset at the time of sale. See
Note 10, “Certain Transfers of Financial Assets and Variable
Interest Entities,” for additional information on the Company's
securitization transactions.
Income earned by the Company on its consumer loan
servicing rights is derived primarily from contractually specified
servicing fees and other ancillary fees. Such income earned for
the year ended December 31, 2015 was $5 million, and is
reported in other noninterest income in the Consolidated
Statements of Income. There was no income earned on consumer
loan servicing rights for the years ended December 31, 2014 and
2013.
At December 31, 2015, the total UPB of consumer indirect
loans serviced was $807 million, all of which were serviced for
third parties. No consumer loan servicing rights were purchased
or sold during the years ended December 31, 2015 and 2014.
Consumer loan servicing rights are accounted for at
amortized cost and are monitored for impairment on an ongoing
basis. The Company calculates the fair value of consumer
servicing rights using a valuation model that calculates the
present value of estimated future net servicing income using
prepayment projections and other assumptions. Impairment, if
any, is recognized when changes in valuation model inputs reflect
a fair value for the servicing asset that is below its respective
carrying value. At December 31, 2015, both the amortized cost
and the fair value of the Company's consumer loan servicing
rights were $9 million.
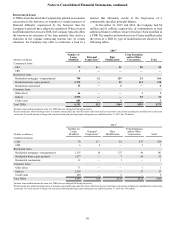
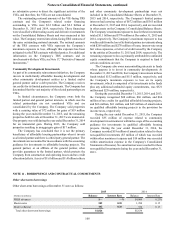
NOTE 10 - CERTAIN TRANSFERS OF FINANCIAL ASSETS AND VARIABLE INTEREST ENTITIES
The Company has transferred loans and securities in sale or
securitization transactions in which the Company retains certain
beneficial interests or retains servicing rights. Cash receipts on
beneficial interests held related to these transfers were $19
million, $21 million, and $36 million for the years ended
December 31, 2015, 2014, and 2013, respectively. The servicing
fees related to these asset transfers (excluding servicing fees for
residential mortgage loan transfers to GSEs, which are discussed
in Note 9, “Goodwill and Other Intangible Assets”) were
immaterial for each of the years ended December 31, 2015, 2014,
and 2013.
When a transfer or other transaction occurs with a VIE, the
Company first determines whether it has a VI in the VIE. A VI
is typically in the form of securities representing retained
interests in transferred assets and, at times, servicing rights and
collateral management fees. When determining whether to
consolidate the VIE, the Company evaluates whether it has both
(i) the power to direct the activities that most significantly impact
the economic performance of the VIE, and (ii) the obligation to
absorb losses, or the right to receive benefits, that could
potentially be significant to the VIE.
To determine whether a transfer should be accounted for as
a sale or a secured borrowing, the Company evaluates whether: