SunTrust 2015 Annual Report Download - page 60
Download and view the complete annual report
Please find page 60 of the 2015 SunTrust annual report below. You can navigate through the pages in the report by either clicking on the pages listed below, or by using the keyword search tool below to find specific information within the annual report.-
 1
1 -
2
-
3
-
4
-
5
-
6
-
7
-
8
-
9
-
10
-
11
-
12
-
13
-
14
-
15
-
16
-
17
-
18
-
19
-
20
-
21
-
22
-
23
-
24
-
25
-
26
-
27
-
28
-
29
-
30
-
31
-
32
-
33
-
34
-
35
-
36
-
37
-
38
-
39
-
40
-
41
-
42
-
43
-
44
-
45
-
46
-
47
-
48
-
49
-
 50
50 -
 51
51 -
 52
52 -
 53
53 -
 54
54 -
 55
55 -
 56
56 -
 57
57 -
 58
58 -
 59
59 -
 60
60 -
 61
61 -
 62
62 -
 63
63 -
 64
64 -
 65
65 -
 66
66 -
 67
67 -
 68
68 -
 69
69 -
 70
70 -
71
-
72
-
73
-
74
-
75
-
76
-
77
-
78
-
79
-
80
-
81
-
82
-
83
-
84
-
85
-
86
-
87
-
88
-
89
-
90
-
91
-
92
-
93
-
94
-
95
-
96
-
97
-
98
-
99
-
100
-
101
-
102
-
103
-
104
-
105
-
106
-
107
-
108
-
109
-
110
-
111
-
112
-
113
-
114
-
115
-
116
-
117
-
118
-
119
-
120
-
121
-
122
-
123
-
124
-
125
-
126
-
127
-
128
-
129
-
130
-
131
-
132
-
133
-
134
-
135
-
136
-
137
-
138
-
139
-
140
-
141
-
142
-
143
-
144
-
145
-
146
-
147
-
148
-
149
-
150
-
151
-
152
-
153
-
154
-
155
-
156
-
157
-
158
-
159
-
160
-
161
-
162
-
163
-
164
-
165
-
166
-
167
-
168
-
169
-
170
-
171
-
172
-
173
-
174
-
175
-
176
-
177
-
178
-
179
-
180
-
181
-
182
-
183
-
184
-
185
-
186
-
187
-
188
-
189
-
190
-
191
-
192
-
193
-
194
-
195
-
196
 |
 |
32
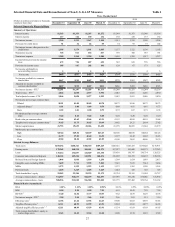
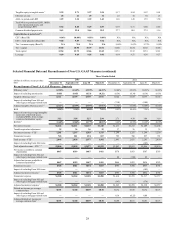
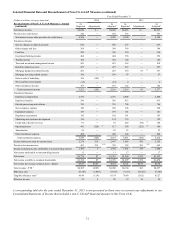
Selected Financial Data and Reconcilement of Non-U.S. GAAP Measures (continued)
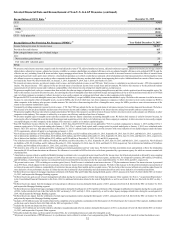
Reconciliation of CET1 Ratio 8December 31, 2015
CET1 9.96%
Less:
MSRs (0.12)
Other 22 (0.04)
CET1 - fully phased-in 9.80%
Reconciliation of Pre-Provision Net Revenue ("PPNR") 23 Year Ended December 31, 2015
Income before provision for income taxes $2,707
Provision for credit losses 165
Debt extinguishment costs, net of related hedges 24
Less:
Net securities gains/(losses) 21
Fair value debt valuation gains 8
PPNR $2,867
1 We present certain income statement categories and also total adjusted revenue-FTE, adjusted noninterest income, adjusted noninterest expense, adjusted net income per average common
diluted share, adjusted net income, adjusted net income available to common shareholders, an adjusted efficiency ratio, an adjusted tangible efficiency ratio, adjusted ROTCE, and the
effective tax rate, excluding Form 8-K items and other legacy mortgage-related items. We believe these measures are useful to investors because it removes the effect of material items
impacting the periods' results and is more reflective of normalized operations as it reflects results that are primarily client relationship and client transaction driven. Removing these items
also allows investors to compare our results to other companies in the industry that may not have had similar items impacting their results. Additional detail on certain of these items can
be found in the Form 8-Ks filed with the SEC on January, 5, 2015, September 9, 2014, July 3, 2014, and October 10, 2013.
2 We present net interest income, net interest margin, total revenue, and total adjusted revenue on an FTE basis. Total revenue is calculated as net interest income - FTE plus noninterest
income. Net interest income - FTE adjusts for the tax-favored status of net interest income from certain loans and investments. We believe this measure to be the preferred industry
measurement of net interest income and it enhances comparability of net interest income arising from taxable and tax-exempt sources.
3 We present a tangible book value per common share that excludes the after-tax impact of purchase accounting intangible assets and also excludes preferred stock from tangible equity. We
believe this measure is useful to investors because, by removing the effect of intangible assets that result from merger and acquisition activity as well as preferred stock (the level of which
may vary from company to company), it allows investors to more easily compare our common stock book value to other companies in the industry.
4 We present ROTCE to exclude intangible assets (net of deferred tax liabilities), except for MSRs, from average common shareholders' equity. We believe this measure is useful to investors
because, by removing the effect of intangible assets, except for MSRs, (the level of which may vary from company to company), it allows investors to more easily compare our ROE to
other companies in the industry who present a similar measure. We also believe that removing the effect of intangible assets, except for MSRs, provides a more relevant measure of the
return on our common shareholders' equity.
5 Computed by dividing noninterest expense by total revenue - FTE. The FTE basis adjusts for the tax-favored status of net interest income from certain loans and investments. We believe
this measure to be the preferred industry measurement of net interest income and it enhances comparability of net interest income arising from taxable and tax-exempt sources.
6 We present a tangible efficiency ratio which excludes amortization. We believe this measure is useful to investors because it allows investors to more easily compare our efficiency to other
companies in the industry. This measure is utilized by us to assess our efficiency and that of our lines of business.
7 We present a tangible equity to tangible assets ratio that excludes the after-tax impact of purchase accounting intangible assets. We believe this measure is useful to investors because, by
removing the effect of intangible assets that result from merger and acquisition activity (the level of which may vary from company to company), it allows investors to more easily compare
our capital adequacy to other companies in the industry. This measure is used by us to analyze capital adequacy.
8 Basel III Final Rules became effective for us on January 1, 2015; thus, Basel III CET1 ratios are not applicable ("N/A") in periods ending prior to January 1, 2015 and Basel I Tier 1
common equity ratio is N/A in periods ending after January 1, 2015. Tier 1 capital, Total capital, and Leverage ratios for periods ended prior to January 1, 2015 were calculated under
Basel I. The CET1 ratio on a fully phased-in basis at December 31, 2015 is estimated and is presented to provide investors with some indication of our capital adequacy under the future
CET1 requirements, which will apply to us beginning on January 1, 2018.
9 Net of deferred tax liabilities of $240 million, $237 million, $234 million, and $231 million at December 31, 2015, September 30, 2015, June 30, 2015, and March 31, 2015, respectively.
Net of deferred tax liabilities of $214 million, $210 million, $206 million, and $193 million at December 31, 2014, September 30, 2014, June 30, 2014, and March 31, 2014, respectively.
Net of deferred tax liabilities of $186 million, $163 million, and $154 million at December 31, 2013, 2012, and 2011, respectively.
10 Net of deferred tax liabilities of $3 million, $4 million, $4 million, and $0 at December 31, 2015, September 30, 2015, June 30, 2015, and March 31, 2015, respectively. Net of deferred
tax liabilities of $0, $0, $1 million, and $1 million at December 31, 2014, September 30, 2014, June 30, 2014, and March 31, 2014, respectively. Net of deferred tax liabilities of $2 million,
$7 million, and $16 million at December 31, 2013, 2012, and 2011, respectively.
11 We present a ratio of ALLL to period-end LHFI, excluding government-guaranteed and fair value loans. We believe that this presentation more appropriately reflects the relationship
between the ALLL and loans that attract an allowance. No allowance is recorded for LHFI at fair value or for loans guaranteed by a government agency for which we assume nominal risk
of principal loss.
12 Amortization expense related to qualified affordable housing investment costs is recognized in provision/(benefit) for income taxes for all periods presented as allowed by an accounting
standard adopted in 2014. Prior to the first quarter of 2014, these amounts were recognized in other noninterest expense, and therefore, for comparative purposes, $49 million, $39 million,
and $40 million, of amortization expense was reclassified to provision/(benefit) for income taxes for the years ended December 31, 2013, 2012, and 2011, respectively.
13 We present total revenue - FTE excluding net securities gains/(losses). Total Revenue is calculated as net interest income - FTE plus noninterest income. Net interest income is presented
on an FTE basis, which adjusts for the tax-favored status of net interest income from certain loans and investments. We believe this measure to be the preferred industry measurement of
net interest income and it enhances comparability of net interest income arising from taxable and tax-exempt sources. We also believe that revenue without net securities gains/(losses) is
more indicative of our performance because it isolates income that is primarily client relationship and client transaction driven and is more indicative of normalized operations.
14 Reflects the pre-tax impact of mortgage repurchase settlements with Fannie Mae and Freddie Mac during the third quarter of 2013, announced in Form 8-K filed with the SEC on October
10, 2013, and impacts the Mortgage Banking segment.
15 Reflects the pre-tax gain on sale of asset management subsidiary during the second quarter of 2014 that impacts the Corporate Other segment. See Note 2, "Acquisitions/Dispositions,"
to the Consolidated Financial Statements in this Form 10-K for additional information related to the sale of RidgeWorth, as well as our Form 8-K that was filed with the SEC on July 3,
2014.
16 Reflects the pre-tax impact from the mortgage servicing advances allowance increase during the third quarter of 2013, announced in Form 8-K filed with the SEC on October 10, 2013,
and impacts the Mortgage Banking segment.
17 Reflects the pre-tax impact from legacy mortgage-related matters during the fourth quarter of 2014 and the settlement of the mortgage modification investigation during the second quarter
of 2014, further detailed in Form 8-Ks filed with the SEC on January 5, 2015 and July 3, 2014, respectively, as well as other legacy mortgage-related items during the second quarter of
2014, which impact the Mortgage Banking segment.
18 Reflects the pre-tax impact from the settlement of certain legal and regulatory matters during the third quarter of 2013, announced in Form 8-K filed with the SEC on October 10, 2013,
and primarily impacts the Mortgage Banking segment.
19 Includes a $130 million income tax benefit related to the completion of a tax authority examination in the third quarter of 2014 that impacts the Corporate Other segment. Additional detail
on this item can be found in Form 8-K filed with the SEC on September 9, 2014.
20 Includes the income tax impact on above items.
21 Includes a $113 million net tax benefit related to subsidiary reorganization and other tax matters during the third quarter of 2013, as disclosed in Form 8-K filed with the SEC on October
10, 2013, and impacts the Corporate Other segment.
22 Primarily includes the phase-out from capital of certain DTAs, the overfunded pension asset, and other intangible assets.
23 We present a reconciliation of PPNR because it is a performance metric utilized in certain of our compensation plans. PPNR impacts the level of awards if certain thresholds are met.