SunTrust 2015 Annual Report Download - page 147
Download and view the complete annual report
Please find page 147 of the 2015 SunTrust annual report below. You can navigate through the pages in the report by either clicking on the pages listed below, or by using the keyword search tool below to find specific information within the annual report.-
 1
1 -
2
-
3
-
4
-
5
-
6
-
7
-
8
-
9
-
10
-
11
-
12
-
13
-
14
-
15
-
16
-
17
-
18
-
19
-
20
-
21
-
22
-
23
-
24
-
25
-
26
-
27
-
28
-
29
-
30
-
31
-
32
-
33
-
34
-
35
-
36
-
37
-
38
-
39
-
40
-
41
-
42
-
43
-
44
-
45
-
46
-
47
-
48
-
49
-
50
-
51
-
52
-
53
-
54
-
55
-
56
-
57
-
58
-
59
-
60
-
61
-
62
-
63
-
64
-
65
-
66
-
67
-
68
-
69
-
70
-
71
-
72
-
73
-
74
-
75
-
76
-
77
-
78
-
79
-
80
-
81
-
82
-
83
-
84
-
85
-
86
-
87
-
88
-
89
-
90
-
91
-
92
-
93
-
94
-
95
-
96
-
97
-
98
-
99
-
100
-
101
-
102
-
103
-
104
-
105
-
106
-
107
-
108
-
109
-
110
-
111
-
112
-
113
-
114
-
115
-
116
-
117
-
118
-
119
-
120
-
121
-
122
-
123
-
124
-
125
-
126
-
127
-
128
-
129
-
130
-
131
-
132
-
133
-
134
-
135
-
136
-
 137
137 -
 138
138 -
 139
139 -
 140
140 -
 141
141 -
 142
142 -
 143
143 -
 144
144 -
 145
145 -
 146
146 -
 147
147 -
 148
148 -
 149
149 -
 150
150 -
 151
151 -
 152
152 -
 153
153 -
 154
154 -
 155
155 -
 156
156 -
 157
157 -
158
-
159
-
160
-
161
-
162
-
163
-
164
-
165
-
166
-
167
-
168
-
169
-
170
-
171
-
172
-
173
-
174
-
175
-
176
-
177
-
178
-
179
-
180
-
181
-
182
-
183
-
184
-
185
-
186
-
187
-
188
-
189
-
190
-
191
-
192
-
193
-
194
-
195
-
196
 |
 |

Notes to Consolidated Financial Statements, continued
119
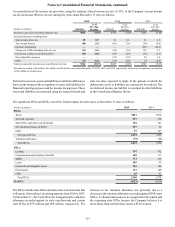
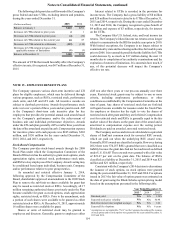
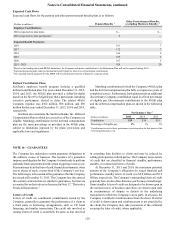
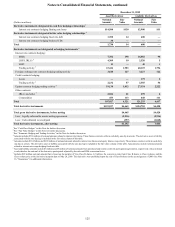
Plan Assets Measured at Fair Value
The following tables present combined pension and other postretirement benefit plan assets measured at fair value. See Note 18,
"Fair Value Election and Measurement" for level definitions within the fair value hierarchy.
Fair Value Measurements at December 31, 2015 1
(Dollars in millions) Total Level 1 Level 2 Level 3
Money market funds 2$83 $83 $— $—
Equity securities 1,416 1,416 — —
Mutual funds 3:
Equity index fund 48 48 — —
Tax exempt municipal bond funds 84 84 — —
Taxable fixed income index funds 13 13 — —
Futures contracts (11) — (11) —
Fixed income securities 1,381 — 1,381 —
Other assets 11 11 — —
Total plan assets $3,025 $1,655 $1,370 $—
1 Fair value measurements do not include pension benefits accrued income amounting to less than 0.4% of total plan assets.
2 Includes $11 million for other postretirement benefit plans.
3 Relates exclusively to other postretirement benefit plans.
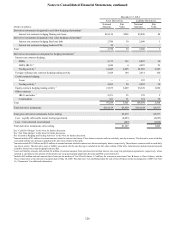
Fair Value Measurements at December 31, 2014 1
(Dollars in millions) Total Level 1 Level 2 Level 3
Money market funds 2$135 $135 $— $—
Equity securities 1,467 1,467 — —
Mutual funds 3:
Equity index fund 51 51 — —
Tax exempt municipal bond funds 82 82 — —
Taxable fixed income index funds 14 14 — —
Futures contracts (21) — (21) —
Fixed income securities 1,478 107 1,371 —
Other assets 17 17 — —
Total plan assets $3,223 $1,873 $1,350 $—
1 Fair value measurements do not include pension benefits accrued income amounting to less than 0.6% of total plan assets.
2 Includes $13 million for other postretirement benefit plans.
3 Relates exclusively to other postretirement benefit plans.
The target allocations for pension and other postretirement benefit assets, by asset category, at December 31 are as follows:
Pension Benefits Other Postretirement Benefits
Target
Allocation
% of plan assets Target
Allocation
% of plan assets
2015 2014 2015 2014
Cash equivalents 0-10 % 3% 4% 5-15 % 7% 8%
Equity securities 0-50 49 48 20-40 31 32
Debt securities 50-100 48 48 50-70 62 60
Total 100% 100% 100% 100%
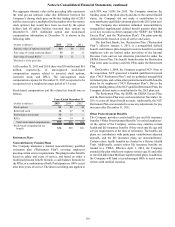
The Company sets pension asset values equal to their market
value, reflecting gains and losses immediately rather than
deferring over a period of years, which provides a more realistic
economic measure of the plan’s funded status and cost. Assumed
healthcare cost trend rates have a significant effect on the
amounts reported for the other postretirement benefit plans. At
December 31, 2015, the Company assumed that pre-65 retiree
healthcare costs will increase at an initial rate of 7.25% per year.
The Company expects this annual cost increase to decrease over
a 9-year period to 5.00% per year. The effect of a 1% increase/
decrease in the healthcare cost trend rate for other postretirement
benefit obligations, service cost, and interest cost are less than
$1 million, respectively. Assumed discount rates and expected
returns on plan assets affect the amounts of net periodic benefit.
A 25 basis point increase/decrease in the expected long-term
return on plan assets would increase/decrease the net periodic
benefit by $8 million for pension and other postretirement
benefits plans. A 25 basis point increase/decrease in the discount
rate would change the net periodic benefit by less than $1 million
for pension and other postretirement benefits plans.