SunTrust 2015 Annual Report Download - page 6
Download and view the complete annual report
Please find page 6 of the 2015 SunTrust annual report below. You can navigate through the pages in the report by either clicking on the pages listed below, or by using the keyword search tool below to find specific information within the annual report.-
 1
1 -
 2
2 -
 3
3 -
 4
4 -
 5
5 -
 6
6 -
 7
7 -
 8
8 -
 9
9 -
 10
10 -
 11
11 -
 12
12 -
 13
13 -
 14
14 -
 15
15 -
 16
16 -
 17
17 -
18
-
19
-
20
-
21
-
22
-
23
-
24
-
25
-
26
-
27
-
28
-
29
-
30
-
31
-
32
-
33
-
34
-
35
-
36
-
37
-
38
-
39
-
40
-
41
-
42
-
43
-
44
-
45
-
46
-
47
-
48
-
49
-
50
-
51
-
52
-
53
-
54
-
55
-
56
-
57
-
58
-
59
-
60
-
61
-
62
-
63
-
64
-
65
-
66
-
67
-
68
-
69
-
70
-
71
-
72
-
73
-
74
-
75
-
76
-
77
-
78
-
79
-
80
-
81
-
82
-
83
-
84
-
85
-
86
-
87
-
88
-
89
-
90
-
91
-
92
-
93
-
94
-
95
-
96
-
97
-
98
-
99
-
100
-
101
-
102
-
103
-
104
-
105
-
106
-
107
-
108
-
109
-
110
-
111
-
112
-
113
-
114
-
115
-
116
-
117
-
118
-
119
-
120
-
121
-
122
-
123
-
124
-
125
-
126
-
127
-
128
-
129
-
130
-
131
-
132
-
133
-
134
-
135
-
136
-
137
-
138
-
139
-
140
-
141
-
142
-
143
-
144
-
145
-
146
-
147
-
148
-
149
-
150
-
151
-
152
-
153
-
154
-
155
-
156
-
157
-
158
-
159
-
160
-
161
-
162
-
163
-
164
-
165
-
166
-
167
-
168
-
169
-
170
-
171
-
172
-
173
-
174
-
175
-
176
-
177
-
178
-
179
-
180
-
181
-
182
-
183
-
184
-
185
-
186
-
187
-
188
-
189
-
190
-
191
-
192
-
193
-
194
-
195
-
196
 |
 |

4
a SunTrust credit card. In the second half of 2015, 18% of our
mortgage clients accepted this offer. In addition, the number of
converted referrals from Mortgage to Private Wealth Management
doubled, compared to 2014. All of these initiatives are in early
stages, but are critical in helping meet our strategic objective of
deepening client relationships.
Collectively, these examples reflect the breadth of our capabilities
and the diversity of our overall business model. I am proud of
the progress we have made, but also believe we still have further
opportunity to deliver the full capabilities of SunTrust to both
current and prospective clients.
IMPROVING EFFICIENCY
Improving efficiency continues to be a strategic priority, with a
long-term objective of reducing the ratio to under 60%. We have
made significant progress over the past few years, as we have
improved our adjusted tangible efficiency ratio1 from 72% in 2011 to
under 63% in 2015. This progress has been driven predominantly
by a 17% reduction in expenses, an accomplishment that has
been achieved while also making significant investments in our
businesses and infrastructure. Despite this progress, our focus on
disciplined expense management and cost reduction initiatives
remains high, as it will help fund investments in growth and, thus,
result in continued improvement in overall efficiency.
In Consumer Banking, we have increased our technology spend
to further our Omni-Channel strategy, which has resulted in a
greatly improved virtual experience for our clients and has enabled
us to reduce the physical presence of our retail branch network.
This, combined with broader real estate consolidation in many
other parts of our organization, has led to a 17% reduction in total
company-wide square footage over the past four years. In fact, our
entire executive management team moved into a new space in
2015, allowing us to both double our real estate density and create
a more engaging and collaborative work environment amongst our
teammates. I have been highly energized by the increased activity
and camaraderie in our new space, which we call OneTeam Central.
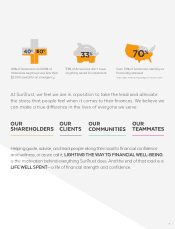
These collective savings are being invested in client-facing digital
capabilities, as self-service utilization among consumers continues
to increase. At the end of 2015, self-service consumer deposits,
excluding direct deposits, represented 38% of total consumer
deposits, and digital sales represented 14% of total sales, both up
meaningfully, relative to the prior year.
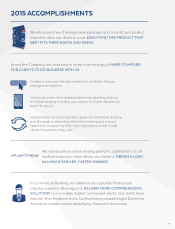
Separately, we continue to invest in better tools and technology
to streamline various processes and better equip our teammates,
which yields an improved client experience, increased teammate
capacity, and lower costs. In both Wholesale Banking and
Mortgage, we made the transition to new loan origination systems
which streamline information sharing among all parties and
greatly improve the speed and transparency of the loan origination
process. In Mortgage, this transition also allowed us to more
efficiently meet the new TRID3 regulatory requirements which
became effective October 1, 2015. Both transitions were significant
and important undertakings, and we expect to see the full benefit
of these new platforms in 2016.
OPTIMIZING THE BALANCE SHEET & IMPROVING RETURNS
Our third strategic priority focuses on optimizing our balance
sheet and improving returns. This strategy once focused primarily
on reducing our residential-related exposure to achieve a more
diversified loan portfolio; however, since this objective was
achieved ahead of schedule, our focus has migrated to enhancing
returns within the current portfolio.
Within Wholesale Banking, we intensified our focus on improving
the risk-adjusted return on each client and became more diligent
in ensuring that our return hurdles were being achieved when
considering the total relationship. As I mentioned earlier, we
have had great success in growing deposits in the Wholesale
Banking business, which has the dual benefit of deepening client
relationships and improving our overall returns.
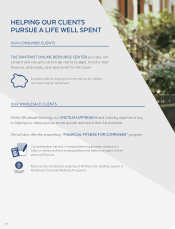
In our Consumer Banking segment, we are focused on improving
the returns and growth of our consumer lending portfolio by
“We have made significant
progress over the past few years,
as we have improved our
adjusted tangible efficiency
ratio1 from 72% in 2011 to
under 63% in 2015. Despite
this progress, our focus on
disciplined expense management
and cost reduction initiatives
remains high, as it will help fund
investments in growth and, thus,
result in continued improvement
in overall efficiency.”
1 See reconciliation of non-U.S. GAAP measures in Table 1, “Selected Financial Data and Reconcilement of Non-U.S. GAAP Measures,” in the MD&A section (Item 7) of the Company’s 2015 Annual
Report on Form 10-K.
3 TILA-RESPA Integrated Disclosure Rule