SunTrust 2015 Annual Report Download - page 169
Download and view the complete annual report
Please find page 169 of the 2015 SunTrust annual report below. You can navigate through the pages in the report by either clicking on the pages listed below, or by using the keyword search tool below to find specific information within the annual report.-
 1
1 -
2
-
3
-
4
-
5
-
6
-
7
-
8
-
9
-
10
-
11
-
12
-
13
-
14
-
15
-
16
-
17
-
18
-
19
-
20
-
21
-
22
-
23
-
24
-
25
-
26
-
27
-
28
-
29
-
30
-
31
-
32
-
33
-
34
-
35
-
36
-
37
-
38
-
39
-
40
-
41
-
42
-
43
-
44
-
45
-
46
-
47
-
48
-
49
-
50
-
51
-
52
-
53
-
54
-
55
-
56
-
57
-
58
-
59
-
60
-
61
-
62
-
63
-
64
-
65
-
66
-
67
-
68
-
69
-
70
-
71
-
72
-
73
-
74
-
75
-
76
-
77
-
78
-
79
-
80
-
81
-
82
-
83
-
84
-
85
-
86
-
87
-
88
-
89
-
90
-
91
-
92
-
93
-
94
-
95
-
96
-
97
-
98
-
99
-
100
-
101
-
102
-
103
-
104
-
105
-
106
-
107
-
108
-
109
-
110
-
111
-
112
-
113
-
114
-
115
-
116
-
117
-
118
-
119
-
120
-
121
-
122
-
123
-
124
-
125
-
126
-
127
-
128
-
129
-
130
-
131
-
132
-
133
-
134
-
135
-
136
-
137
-
138
-
139
-
140
-
141
-
142
-
143
-
144
-
145
-
146
-
147
-
148
-
149
-
150
-
151
-
152
-
153
-
154
-
155
-
156
-
157
-
158
-
 159
159 -
 160
160 -
 161
161 -
 162
162 -
 163
163 -
 164
164 -
 165
165 -
 166
166 -
 167
167 -
 168
168 -
 169
169 -
 170
170 -
 171
171 -
 172
172 -
 173
173 -
 174
174 -
 175
175 -
 176
176 -
 177
177 -
 178
178 -
 179
179 -
180
-
181
-
182
-
183
-
184
-
185
-
186
-
187
-
188
-
189
-
190
-
191
-
192
-
193
-
194
-
195
-
196
 |
 |

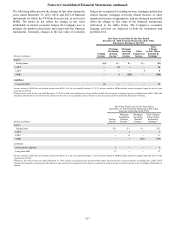
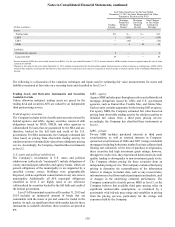
Notes to Consolidated Financial Statements, continued
141
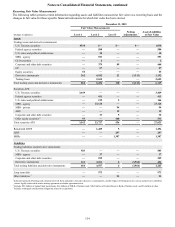
trades and indications from buy side investors, if available, are
taken into consideration as additional support for the value. Due
to the availability of this information, the Company determined
that the appropriate classification for these debt issuances is level
2. The election to fair value certain fixed rate debt issuances was
made to align the accounting for the debt with the accounting
for offsetting derivative positions, without having to apply hedge
accounting, thus avoiding the complex and time consuming fair
value hedge accounting requirements.
The Company’s public debt measured at fair value impacts
earnings predominantly through changes in the Company’s
credit spreads as the Company has entered into derivative
financial instruments that economically convert the interest rate
on the debt from a fixed to a floating rate. The estimated earnings
impact from changes in credit spreads above U.S. Treasury rates
resulted in an immaterial amount of losses for the year ended
December 31, 2015, and losses of $19 million and gains of $40
million for the years ended December 31, 2014 and 2013,
respectively.
Other liabilities
The Company’s other liabilities that are measured at fair value
on a recurring basis include contingent consideration obligations
related to acquisitions. Contingent consideration associated with
acquisitions is adjusted to fair value until settled. As the
assumptions used to measure fair value are based on internal
metrics that are not market observable, the earn-out liability is
considered level 3.
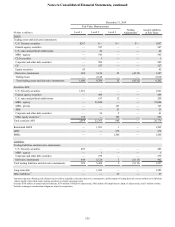
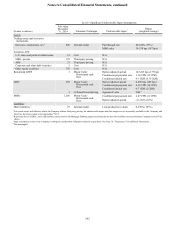
The valuation technique and range, including weighted average, of the unobservable inputs associated with the Company's level 3
assets and liabilities are as follows:
Level 3 Significant Unobservable Input Assumptions
(Dollars in millions)
Fair value
December
31, 2015 Valuation Technique Unobservable Input 1Range
(weighted average)
Assets
Trading assets and derivative
instruments:
Corporate and other debt securities $89 Market comparables Yield adjustment 126-447 bps (287 bps)
Derivative instruments, net 215 Internal model Pull through rate 24-100% (79%)
MSR value 29-210 bps (103 bps)
Securities AFS:
U.S. states and political subdivisions 5 Cost N/A
MBS - private 94 Third party pricing N/A
ABS 12 Third party pricing N/A
Corporate and other debt securities 5Cost N/A
Other equity securities 440 Cost N/A
Residential LHFS 5 Monte Carlo/
Discounted cash
flow
Option adjusted spread 104-197 bps (125 bps)
Conditional prepayment
rate 2-17 CPR (8 CPR)
Conditional default rate 0-2 CDR (0.5 CDR)
LHFI 251 Monte Carlo/
Discounted cash
flow
Option adjusted spread 62-784 bps (193 bps)
Conditional prepayment
rate 5-36 CPR (14 CPR)
Conditional default rate 0-5 CDR (2 CDR)
6 Collateral based
pricing Appraised value NM 4
MSRs 1,307 Monte Carlo/
Discounted cash
flow
Conditional prepayment
rate 2-21 CPR (10 CPR)
Option adjusted spread (5)-110% (8%)
Liabilities
Other liabilities 323 Internal model Loan production volume 150% (150%)
1 For certain assets and liabilities where the Company utilizes third party pricing, the unobservable inputs and their ranges are not reasonably available to the Company, and
therefore, have been noted as not applicable ("N/A").
2 Represents the net of IRLC assets and liabilities entered into by the Mortgage Banking segment and includes the derivative liability associated with the Company's sale of Visa
shares.
3 Input assumptions relate to the Company's contingent consideration obligations related to acquisitions. See Note 16, "Guarantees," for additional information.
4 Not meaningful.