SunTrust 2015 Annual Report Download - page 175
Download and view the complete annual report
Please find page 175 of the 2015 SunTrust annual report below. You can navigate through the pages in the report by either clicking on the pages listed below, or by using the keyword search tool below to find specific information within the annual report.-
 1
1 -
2
-
3
-
4
-
5
-
6
-
7
-
8
-
9
-
10
-
11
-
12
-
13
-
14
-
15
-
16
-
17
-
18
-
19
-
20
-
21
-
22
-
23
-
24
-
25
-
26
-
27
-
28
-
29
-
30
-
31
-
32
-
33
-
34
-
35
-
36
-
37
-
38
-
39
-
40
-
41
-
42
-
43
-
44
-
45
-
46
-
47
-
48
-
49
-
50
-
51
-
52
-
53
-
54
-
55
-
56
-
57
-
58
-
59
-
60
-
61
-
62
-
63
-
64
-
65
-
66
-
67
-
68
-
69
-
70
-
71
-
72
-
73
-
74
-
75
-
76
-
77
-
78
-
79
-
80
-
81
-
82
-
83
-
84
-
85
-
86
-
87
-
88
-
89
-
90
-
91
-
92
-
93
-
94
-
95
-
96
-
97
-
98
-
99
-
100
-
101
-
102
-
103
-
104
-
105
-
106
-
107
-
108
-
109
-
110
-
111
-
112
-
113
-
114
-
115
-
116
-
117
-
118
-
119
-
120
-
121
-
122
-
123
-
124
-
125
-
126
-
127
-
128
-
129
-
130
-
131
-
132
-
133
-
134
-
135
-
136
-
137
-
138
-
139
-
140
-
141
-
142
-
143
-
144
-
145
-
146
-
147
-
148
-
149
-
150
-
151
-
152
-
153
-
154
-
155
-
156
-
157
-
158
-
159
-
160
-
161
-
162
-
163
-
164
-
 165
165 -
 166
166 -
 167
167 -
 168
168 -
 169
169 -
 170
170 -
 171
171 -
 172
172 -
 173
173 -
 174
174 -
 175
175 -
 176
176 -
 177
177 -
 178
178 -
 179
179 -
 180
180 -
 181
181 -
 182
182 -
 183
183 -
 184
184 -
 185
185 -
186
-
187
-
188
-
189
-
190
-
191
-
192
-
193
-
194
-
195
-
196
 |
 |
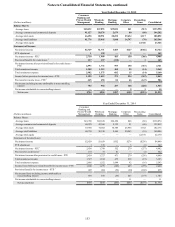
Notes to Consolidated Financial Statements, continued
147
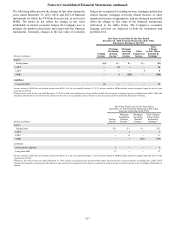
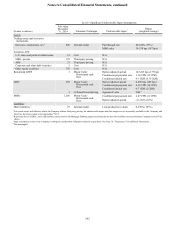
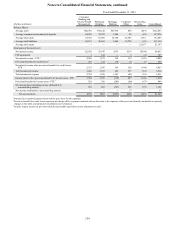
December 31, 2014 Fair Value Measurements
(Dollars in millions)
Measured
Amount
Fair
Value Level 1 Level 2 Level 3
Financial assets:
Cash and cash equivalents $8,229 $8,229 $8,229 $— $— (a)
Trading assets and derivative instruments 6,202 6,202 1,000 5,177 25 (b)
Securities AFS 26,770 26,770 2,059 23,765 946 (b)
LHFS 3,232 3,240 — 2,063 1,177 (c)
LHFI, net 131,175 126,855 — 545 126,310 (d)
Financial liabilities:
Deposits 140,567 140,562 — 140,562 — (e)
Short-term borrowings 9,186 9,186 — 9,186 — (f)
Long-term debt 13,022 13,056 — 12,398 658 (f)
Trading liabilities and derivative instruments 1,227 1,227 929 293 5 (b)
The following methods and assumptions were used by the Company in estimating the fair value of financial instruments:
(a) Cash and cash equivalents are valued at their carrying
amounts, which are reasonable estimates of fair value due
to the relatively short period to maturity of the instruments.
(b) Trading assets and derivative instruments, securities AFS,
and trading liabilities and derivative instruments that are
classified as level 1 are valued based on quoted market
prices. For those instruments classified as level 2 or 3, refer
to the respective valuation discussions within this footnote.
(c) LHFS are generally valued based on observable current
market prices or, if quoted market prices are not available,
quoted market prices of similar instruments. Refer to the
LHFS section within this footnote for further discussion.
When valuation assumptions are not readily observable in
the market, instruments are valued based on the best
available data to approximate fair value. This data may be
internally developed and considers risk premiums that a
market participant would require under then-current market
conditions.
(d) LHFI fair values are based on a hypothetical exit price,
which does not represent the estimated intrinsic value of the
loan if held for investment. The assumptions used are
expected to approximate those that a market participant
purchasing the loans would use to value the loans, including
a market risk premium and liquidity discount. Estimating
the fair value of the loan portfolio when loan sales and
trading markets are illiquid or nonexistent requires
significant judgment.
Generally, the Company measures fair value for LHFI
based on estimated future discounted cash flows using
current origination rates for loans with similar terms and
credit quality, which derived an estimated value of 101%
and 100% on the loan portfolio’s net carrying value at
December 31, 2015 and 2014, respectively. The value
derived from origination rates likely does not represent an
exit price; therefore, an incremental market risk and
liquidity discount was applied when estimating the fair value
of these loans. The discounted value is a function of a market
participant’s required yield in the current environment and
is not a reflection of the expected cumulative losses on the
loans.
(e) Deposit liabilities with no defined maturity such as DDAs,
NOW/money market accounts, and savings accounts have
a fair value equal to the amount payable on demand at the
reporting date (i.e., their carrying amounts). Fair values for
CDs are estimated using a discounted cash flow approach
that applies current interest rates to a schedule of aggregated
expected maturities. The assumptions used in the discounted
cash flow analysis are expected to approximate those that
market participants would use in valuing deposits. The value
of long-term relationships with depositors is not taken into
account in estimating fair values.
(f) Fair values for short-term borrowings and certain long-term
debt are based on quoted market prices for similar
instruments or estimated discounted cash flows utilizing the
Company’s current incremental borrowing rate for similar
types of instruments. For long-term debt that the Company
measures at fair value, refer to the respective valuation
section within this footnote. For level 3 debt, the terms are
unique in nature or there are no similar instruments that can
be used to value the instrument without using significant
unobservable assumptions. In these situations, the
Company reviews current borrowing rates along with the
collateral levels that secure the debt in determining an
appropriate fair value adjustment.
Unfunded loan commitments and letters of credit are not
included in the table above. At December 31, 2015 and 2014,
the Company had $66.2 billion and $56.5 billion, respectively,
of unfunded commercial loan commitments and letters of credit.
A reasonable estimate of the fair value of these instruments is
the carrying value of deferred fees plus the related unfunded
commitments reserve, which was a combined $66 million and
$59 million at December 31, 2015 and 2014, respectively. No
active trading market exists for these instruments, and the
estimated fair value does not include value associated with the
borrower relationship. The Company does not estimate the fair
values of consumer unfunded lending commitments which can
generally be canceled by providing notice to the borrower.