SunTrust 2015 Annual Report Download - page 94
Download and view the complete annual report
Please find page 94 of the 2015 SunTrust annual report below. You can navigate through the pages in the report by either clicking on the pages listed below, or by using the keyword search tool below to find specific information within the annual report.-
 1
1 -
2
-
3
-
4
-
5
-
6
-
7
-
8
-
9
-
10
-
11
-
12
-
13
-
14
-
15
-
16
-
17
-
18
-
19
-
20
-
21
-
22
-
23
-
24
-
25
-
26
-
27
-
28
-
29
-
30
-
31
-
32
-
33
-
34
-
35
-
36
-
37
-
38
-
39
-
40
-
41
-
42
-
43
-
44
-
45
-
46
-
47
-
48
-
49
-
50
-
51
-
52
-
53
-
54
-
55
-
56
-
57
-
58
-
59
-
60
-
61
-
62
-
63
-
64
-
65
-
66
-
67
-
68
-
69
-
70
-
71
-
72
-
73
-
74
-
75
-
76
-
77
-
78
-
79
-
80
-
81
-
82
-
83
-
 84
84 -
 85
85 -
 86
86 -
 87
87 -
 88
88 -
 89
89 -
 90
90 -
 91
91 -
 92
92 -
 93
93 -
 94
94 -
 95
95 -
 96
96 -
 97
97 -
 98
98 -
 99
99 -
 100
100 -
 101
101 -
 102
102 -
 103
103 -
 104
104 -
105
-
106
-
107
-
108
-
109
-
110
-
111
-
112
-
113
-
114
-
115
-
116
-
117
-
118
-
119
-
120
-
121
-
122
-
123
-
124
-
125
-
126
-
127
-
128
-
129
-
130
-
131
-
132
-
133
-
134
-
135
-
136
-
137
-
138
-
139
-
140
-
141
-
142
-
143
-
144
-
145
-
146
-
147
-
148
-
149
-
150
-
151
-
152
-
153
-
154
-
155
-
156
-
157
-
158
-
159
-
160
-
161
-
162
-
163
-
164
-
165
-
166
-
167
-
168
-
169
-
170
-
171
-
172
-
173
-
174
-
175
-
176
-
177
-
178
-
179
-
180
-
181
-
182
-
183
-
184
-
185
-
186
-
187
-
188
-
189
-
190
-
191
-
192
-
193
-
194
-
195
-
196
 |
 |
66
ALCO and the Board, we manage the Parent Company’s
liquidity by structuring its net maturity schedule to minimize the
amount of debt maturing within a short period of time. A majority
of the Parent Company’s liabilities are long-term in nature,
coming from the proceeds of issuances of our capital securities
and long-term senior and subordinated notes. See Note 11,
“Borrowings and Contractual Commitments,” to the
Consolidated Financial Statements in this Form 10-K for further
information regarding Parent Company debt.
We manage the Parent Company to maintain most of its
liquid assets in cash and securities that it could quickly convert
into cash. Unlike the Bank, it is not typical for the Parent
Company to maintain a material investment portfolio of publicly
traded securities. We manage the Parent Company cash balance
to provide sufficient liquidity to fund all forecasted obligations
(primarily debt and capital service) for an extended period of
months in accordance with our risk limits.
The primary uses of Parent Company liquidity include debt
service, dividends on capital instruments, the periodic purchase
of investment securities, loans to our subsidiaries, and common
share repurchases. See further details of the authorized common
share repurchases in the "Capital Resources" section of this
MD&A and in Item 5, "Market for Registrant's Common Equity,
Related Stockholder Matters and Issuer Purchases of Equity
Securities" in this Form 10-K. We fund corporate dividends with
Parent Company cash, the primary sources of which are
dividends from our banking subsidiary and proceeds from the
issuance of debt and capital securities. We are subject to both
state and federal banking regulations that limit our ability to pay
common stock dividends in certain circumstances.
Other Liquidity Considerations. At December 31, 2015, our
liability for UTBs was $100 million and the liability for interest
related to these UTBs was $8 million. The UTBs represent the
difference between tax positions taken or expected to be taken
in our tax returns and the benefits recognized in accordance with
the accounting guidance for income taxes. If taxes related to these
positions are ultimately paid, the payments would be made from
our normal operating cash flows, likely over multiple years. See
additional discussion in Note 14, "Income Taxes," to the
Consolidated Financial Statements in this Form 10-K.
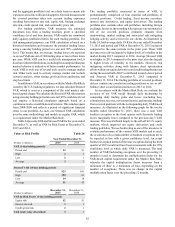
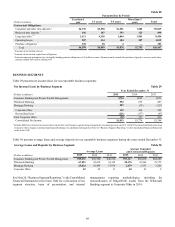
As presented in Table 27, we had an aggregate potential
obligation of $85.5 billion to our clients in unused lines of credit
at December 31, 2015. Commitments to extend credit are
arrangements to lend to clients who have complied with
predetermined contractual obligations. We also had $2.9 billion
in letters of credit at December 31, 2015, most of which are
standby letters of credit, which require that we provide funding
if certain future events occur. Approximately $633 million of
these letters supported variable rate demand obligations at
December 31, 2015. Unused commercial lines of credit have
increased since December 31, 2014, as we continued to provide
credit availability to our clients. Unused credit card lines
increased during 2015 due to our strategic focus on growing this
business and our launch of new, streamlined credit card product
offerings in 2015. Additionally, our mortgage commitments
increased during 2015 due to higher production volume.
Unfunded Lending Commitments Table 27
As of Average for the Three Months Ended
(Dollars in millions)
December 31,
2015
December 31,
2014
December 31,
2015
December 31,
2014
Unused lines of credit:
Commercial $58,855 $50,122 $58,032 $49,932
Mortgage commitments 13,232 3,259 3,215 3,317
Home equity lines 10,523 10,858 10,558 10,873
CRE 4,455 3,302 4,111 3,151
Credit card 8,478 6,675 8,203 6,380
Total unused lines of credit $85,543 $74,216 $84,119 $73,653
Letters of credit:
Financial standby $2,775 $2,917 $2,758 $3,161
Performance standby 137 121 140 64
Commercial 27 32 27 32
Total letters of credit $2,939 $3,070 $2,925 $3,257
1 Includes IRLC contracts with notional balances of $2.3 billion at both December 31, 2015 and 2014.