SunTrust 2015 Annual Report Download - page 63
Download and view the complete annual report
Please find page 63 of the 2015 SunTrust annual report below. You can navigate through the pages in the report by either clicking on the pages listed below, or by using the keyword search tool below to find specific information within the annual report.-
 1
1 -
2
-
3
-
4
-
5
-
6
-
7
-
8
-
9
-
10
-
11
-
12
-
13
-
14
-
15
-
16
-
17
-
18
-
19
-
20
-
21
-
22
-
23
-
24
-
25
-
26
-
27
-
28
-
29
-
30
-
31
-
32
-
33
-
34
-
35
-
36
-
37
-
38
-
39
-
40
-
41
-
42
-
43
-
44
-
45
-
46
-
47
-
48
-
49
-
50
-
51
-
52
-
 53
53 -
 54
54 -
 55
55 -
 56
56 -
 57
57 -
 58
58 -
 59
59 -
 60
60 -
 61
61 -
 62
62 -
 63
63 -
 64
64 -
 65
65 -
 66
66 -
 67
67 -
 68
68 -
 69
69 -
 70
70 -
 71
71 -
 72
72 -
 73
73 -
74
-
75
-
76
-
77
-
78
-
79
-
80
-
81
-
82
-
83
-
84
-
85
-
86
-
87
-
88
-
89
-
90
-
91
-
92
-
93
-
94
-
95
-
96
-
97
-
98
-
99
-
100
-
101
-
102
-
103
-
104
-
105
-
106
-
107
-
108
-
109
-
110
-
111
-
112
-
113
-
114
-
115
-
116
-
117
-
118
-
119
-
120
-
121
-
122
-
123
-
124
-
125
-
126
-
127
-
128
-
129
-
130
-
131
-
132
-
133
-
134
-
135
-
136
-
137
-
138
-
139
-
140
-
141
-
142
-
143
-
144
-
145
-
146
-
147
-
148
-
149
-
150
-
151
-
152
-
153
-
154
-
155
-
156
-
157
-
158
-
159
-
160
-
161
-
162
-
163
-
164
-
165
-
166
-
167
-
168
-
169
-
170
-
171
-
172
-
173
-
174
-
175
-
176
-
177
-
178
-
179
-
180
-
181
-
182
-
183
-
184
-
185
-
186
-
187
-
188
-
189
-
190
-
191
-
192
-
193
-
194
-
195
-
196
 |
 |
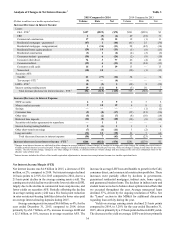
35
by a decline in yield on average commercial loans, particularly
in our C&I portfolio, as well as a decline in yield on average
nonguaranteed residential mortgages. The declines were driven
by lower commercial loan swap income, the paydown of higher
yielding loans, and the addition of new loan production at lower
rates than the existing portfolio due to the highly competitive,
low interest rate environment. Additionally, yields on securities
AFS declined 31 basis points compared to the year ended
December 31, 2014, driven largely by the addition of lower-
yielding U.S. Treasury securities during 2015 in preparation for
LCR requirements that took effect on January 1, 2016. Also
contributing to the decline in yield was higher MBS premium
amortization during 2015 of $208 million, compared to $152
million during 2014, as a result of increased MBS prepayments.
See the "Securities Available for Sale" section in this MD&A for
additional information regarding the composition and associated
yields on our investment securities.
We utilize interest rate swaps to manage interest rate risk.
These instruments are primarily receive-fixed, pay-variable
swaps that convert a portion of our commercial loan portfolio
from floating rates, based on LIBOR, to fixed rates. At
December 31, 2015, the outstanding notional balance of active
swaps that qualified as cash flow hedges on variable rate
commercial loans was $16.9 billion, compared to active swaps
of $15.4 billion at December 31, 2014.
In addition to the income recognized from active swaps, we
also continue to recognize interest income over the original
hedge period resulting from terminated or de-designated swaps
that were previously designated as cash flow hedges on variable
rate commercial loans. Interest income from our commercial
loan swaps decreased to $261 million in 2015, compared to $387
million in 2014. The decline was primarily due to a reduction in
income from the maturity of active and previously terminated
swaps that reached their original maturity date during the second
half of 2014 and in 2015. As we manage our interest rate risk we
may continue to purchase additional and/or terminate existing
interest rate swaps. In 2016, commercial loan swap income will
decline modestly relative to 2015, largely due to a potential
increase in LIBOR, which would be more than offset by higher
net interest income from other areas of the balance sheet.
Remaining swaps on commercial loans have maturities
through 2022. The average maturity of our active swaps at
December 31, 2015 was 3.3 years. The commercial loan swaps
are receive-fixed, pay-variable based on LIBOR. The weighted
average rate on the receive-fixed rate leg of the commercial loan
swap portfolio at December 31, 2015 was 1.38%.
Compared to the year ended December 31, 2014, average
interest-bearing liabilities increased $4.0 billion, or 3%,
primarily due to an increase in average lower-cost deposits,
partially offset by declines in average wholesale funding and
time deposits. Average noninterest-bearing demand deposits also
increased $1.7 billion, or 4%, compared to the year ended
December 31, 2014. The increase in lower-cost deposits enabled
a $4.0 billion, or 65%, decrease in average other short-term
borrowings, primarily FHLB advances and master notes, as well
as a $1.5 billion, or 12%, decrease in average long-term debt,
driven by a decrease in average long-term FHLB advances,
compared to 2014. See the "Borrowings" section in this MD&A
for additional information regarding other short-term
borrowings and long-term debt.
The five basis point reduction in rates paid on average
interest-bearing liabilities during 2015 was driven by slightly
lower rates paid on interest-bearing deposits, as well as a seven
basis point decline in rates paid on other short-term borrowings.
The decline in the average rate paid on interest-bearing deposits
was a result of the improved mix driven by the shift from time
deposits to lower-cost deposit products, as well as a reduction in
rates paid on time deposits as higher rate CDs matured.
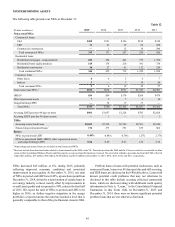
Looking forward, we expect first quarter 2016 net interest
margin to improve two to five basis points relative to the fourth
quarter of 2015 from the benefit of slightly higher short-term
interest rates. We will continue to carefully manage the duration
of our overall balance sheet in light of the current low interest
rate environment, while also ensuring our balance sheet is
structured to benefit from potential increases in short-term rates.
See Table 22, "Net Interest Income Asset Sensitivity," in this
MD&A for an analysis of potential changes in net interest income
due to instantaneous moves in benchmark interest rates.
Foregone Interest
As average nonaccrual loans continued to decrease, foregone
interest income from NPLs had limited effect on the net interest
margin for the year ended December 31, 2015. Foregone interest
income from NPLs reduced net interest margin by two basis
points for the year ended December 31, 2014. See additional
discussion of our expectations of future credit quality in the
“Loans,” “Allowance for Credit Losses,” and “Nonperforming
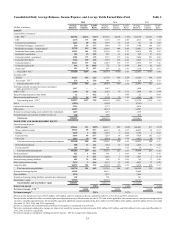
Assets” sections of this MD&A. In addition, Table 2 of this
MD&A contains more detailed information concerning average
balances, yields earned, and rates paid.