SunTrust 2015 Annual Report Download - page 141
Download and view the complete annual report
Please find page 141 of the 2015 SunTrust annual report below. You can navigate through the pages in the report by either clicking on the pages listed below, or by using the keyword search tool below to find specific information within the annual report.-
 1
1 -
2
-
3
-
4
-
5
-
6
-
7
-
8
-
9
-
10
-
11
-
12
-
13
-
14
-
15
-
16
-
17
-
18
-
19
-
20
-
21
-
22
-
23
-
24
-
25
-
26
-
27
-
28
-
29
-
30
-
31
-
32
-
33
-
34
-
35
-
36
-
37
-
38
-
39
-
40
-
41
-
42
-
43
-
44
-
45
-
46
-
47
-
48
-
49
-
50
-
51
-
52
-
53
-
54
-
55
-
56
-
57
-
58
-
59
-
60
-
61
-
62
-
63
-
64
-
65
-
66
-
67
-
68
-
69
-
70
-
71
-
72
-
73
-
74
-
75
-
76
-
77
-
78
-
79
-
80
-
81
-
82
-
83
-
84
-
85
-
86
-
87
-
88
-
89
-
90
-
91
-
92
-
93
-
94
-
95
-
96
-
97
-
98
-
99
-
100
-
101
-
102
-
103
-
104
-
105
-
106
-
107
-
108
-
109
-
110
-
111
-
112
-
113
-
114
-
115
-
116
-
117
-
118
-
119
-
120
-
121
-
122
-
123
-
124
-
125
-
126
-
127
-
128
-
129
-
130
-
 131
131 -
 132
132 -
 133
133 -
 134
134 -
 135
135 -
 136
136 -
 137
137 -
 138
138 -
 139
139 -
 140
140 -
 141
141 -
 142
142 -
 143
143 -
 144
144 -
 145
145 -
 146
146 -
 147
147 -
 148
148 -
 149
149 -
 150
150 -
 151
151 -
152
-
153
-
154
-
155
-
156
-
157
-
158
-
159
-
160
-
161
-
162
-
163
-
164
-
165
-
166
-
167
-
168
-
169
-
170
-
171
-
172
-
173
-
174
-
175
-
176
-
177
-
178
-
179
-
180
-
181
-
182
-
183
-
184
-
185
-
186
-
187
-
188
-
189
-
190
-
191
-
192
-
193
-
194
-
195
-
196
 |
 |

Notes to Consolidated Financial Statements, continued
113
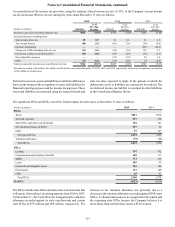
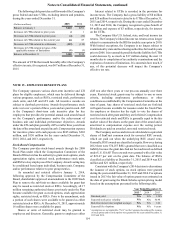
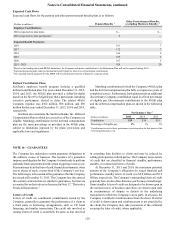
A reconciliation of the income tax provision, using the statutory federal income tax rate of 35%, to the Company’s actual income
tax provision and effective tax rate during the years ended December 31 were as follows:
2015 2014 2013
(Dollars in millions) Amount
% of
Pre-Tax
Income Amount
% of
Pre-Tax
Income Amount
% of
Pre-Tax
Income
Income tax provision at federal statutory rate $944 35.0% $793 35.0% $583 35.0%
Increase/(decrease) resulting from:
State income taxes, net 25 0.9 12 0.5 21 1.2
Tax-exempt interest (88) (3.3) (89) (3.9) (80) (4.8)
Internal restructuring — — — — (343) (20.6)
Changes in UTBs (including interest), net (31) (1.1) (82) (3.6) 152 9.1
Income tax credits, net of amortization 1(69) (2.6) (65) (2.9) (53) (3.2)
Non-deductible expenses — — (57) (2.5) 49 3.0
Other (17) (0.6) (19) (0.8) (7) (0.4)
Total provision for income taxes and effective tax rate $764 28.3% $493 21.8% $322 19.3%
1 Excludes tax credits of $8 million, $21 million, and $0 for the years ended December 31, 2015, 2014, and 2013, respectively, which were recognized as a reduction
to the related investment asset.
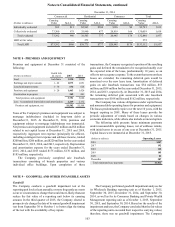
Deferred income tax assets and liabilities result from differences
between the timing of the recognition of assets and liabilities for
financial reporting purposes and for income tax purposes. These
assets and liabilities are measured using the enacted federal and
state tax rates expected to apply in the periods in which the
deferred tax assets or liabilities are expected to be realized. The
net deferred income tax liability is recorded in other liabilities
in the Consolidated Balance Sheets.
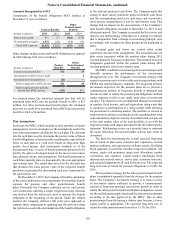
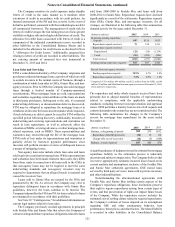
The significant DTAs and DTLs, net of the federal impact for state taxes, at December 31 were as follows:
(Dollars in millions) 2015 2014
DTAs:
ALLL $651 $710
Accrued expenses 297 358
State NOLs and other carryforwards 192 201
Net unrealized losses in AOCI 257 56
Other 97 127
Total gross DTAs 1,494 1,452
Valuation allowance (79) (98)
Total DTAs 1,415 1,354
DTLs:
Leasing 707 762
Compensation and employee benefits 140 113
MSRs 372 515
Loans 109 93
Goodwill and intangible assets 216 190
Fixed assets 131 140
Other 65 61
Total DTLs 1,740 1,874
Net DTL ($325) ($520)
The DTAs include state NOLs and other state carryforwards that
will expire, if not utilized, in varying amounts from 2016 to 2035.
At December 31, 2015 and 2014, the Company had a valuation
allowance recorded against its state carryforwards and certain
state DTAs of $79 million and $98 million, respectively. The
decrease in the valuation allowance was primarily due to a
decrease in the valuation allowance recorded against STM's state
NOLs. A valuation allowance is not required for the federal and
the remaining state DTAs because the Company believes it is
more-likely-than-not that these assets will be realized.