SunTrust 2015 Annual Report Download - page 52
Download and view the complete annual report
Please find page 52 of the 2015 SunTrust annual report below. You can navigate through the pages in the report by either clicking on the pages listed below, or by using the keyword search tool below to find specific information within the annual report.-
 1
1 -
2
-
3
-
4
-
5
-
6
-
7
-
8
-
9
-
10
-
11
-
12
-
13
-
14
-
15
-
16
-
17
-
18
-
19
-
20
-
21
-
22
-
23
-
24
-
25
-
26
-
27
-
28
-
29
-
30
-
31
-
32
-
33
-
34
-
35
-
36
-
37
-
38
-
39
-
40
-
41
-
 42
42 -
 43
43 -
 44
44 -
 45
45 -
 46
46 -
 47
47 -
 48
48 -
 49
49 -
 50
50 -
 51
51 -
 52
52 -
 53
53 -
 54
54 -
 55
55 -
 56
56 -
 57
57 -
 58
58 -
 59
59 -
 60
60 -
 61
61 -
 62
62 -
63
-
64
-
65
-
66
-
67
-
68
-
69
-
70
-
71
-
72
-
73
-
74
-
75
-
76
-
77
-
78
-
79
-
80
-
81
-
82
-
83
-
84
-
85
-
86
-
87
-
88
-
89
-
90
-
91
-
92
-
93
-
94
-
95
-
96
-
97
-
98
-
99
-
100
-
101
-
102
-
103
-
104
-
105
-
106
-
107
-
108
-
109
-
110
-
111
-
112
-
113
-
114
-
115
-
116
-
117
-
118
-
119
-
120
-
121
-
122
-
123
-
124
-
125
-
126
-
127
-
128
-
129
-
130
-
131
-
132
-
133
-
134
-
135
-
136
-
137
-
138
-
139
-
140
-
141
-
142
-
143
-
144
-
145
-
146
-
147
-
148
-
149
-
150
-
151
-
152
-
153
-
154
-
155
-
156
-
157
-
158
-
159
-
160
-
161
-
162
-
163
-
164
-
165
-
166
-
167
-
168
-
169
-
170
-
171
-
172
-
173
-
174
-
175
-
176
-
177
-
178
-
179
-
180
-
181
-
182
-
183
-
184
-
185
-
186
-
187
-
188
-
189
-
190
-
191
-
192
-
193
-
194
-
195
-
196
 |
 |

24
EXECUTIVE OVERVIEW
Financial Performance
We experienced solid earnings growth in 2015, driven by
improved efficiency and continued improvement in asset quality
arising from consistent execution of our strategies and the
diversity of our business model. Targeted loan and deposit
growth during the year, as well as efforts to further optimize our
balance sheet, helped offset the negative impact of the prolonged
low interest rate environment. We were also successful in
advancing the revenue growth trajectory of many of our
businesses while controlling expenses and improving efficiency.
These developments allowed us to meaningfully increase the
capital return for our shareholders by increasing our dividend
and buying back more shares, while also investing in growth
opportunities to enhance future financial performance.
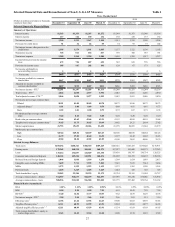
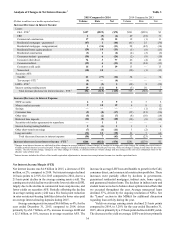
Our net income available to common shareholders totaled
$1.9 billion for 2015, an increase of 8% compared to 2014, with
diluted EPS of $3.58, up 11% from the prior year.
Noteworthy 2015 items included:
• We delivered to our common shareholders 8% net income
growth and 11% EPS growth
• We generated record investment banking income for the year
• Noninterest expense decreased $383 million compared to the
prior year; noninterest expense decreased $59 million
compared to the prior year adjusted level
• We continued to become more efficient, evidenced by the
efficiency ratio and adjusted tangible efficiency ratio
improving from 66.7% and 63.3% in 2014 to 63.1% and 62.6%
in 2015, respectively, marking the fourth consecutive year of
improvement
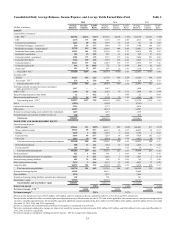
• Average total loans increased 2% compared to the prior year,
with approximately 8% growth in C&I loans
• Average consumer and commercial deposits increased 9%
compared to the prior year, with the favorable mix shift toward
lower-cost deposits continuing
• We maintained strong capital ratios that continue to be well
above regulatory requirements, with our Basel III CET1 and
estimated, fully phased-in CET1* ratios at 9.96% and 9.80%,
respectively
• We repurchased approximately $680 million of common
shares, resulting in a 3% decline in outstanding shares, and
increased our quarterly common stock dividend by 20%.
• Book value per share was $43.66, and tangible book value per
share* was $31.65, up 5% and 6%, respectively, from the prior
year
• Asset quality continued to improve as NPAs declined 6% from
the prior year and NPLs totaled 0.49% of total loans
• Our provision for loan losses declined $182 million, or 54%,
compared to the prior year
• Net charge-offs were down $104 million, or 23%, compared
to 2014, representing 0.26% of average loans, down eight basis
points from the prior year
• Our LCR is above the January 1, 2016 requirement of 90%
• Our ROE and ROTCE* improved by 36 and 31 basis points
compared to the prior year, to 8.42% and 11.64%, respectively
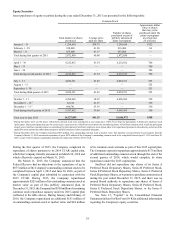
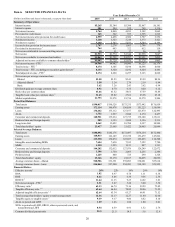
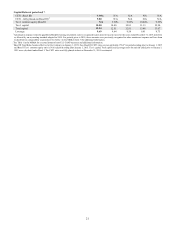
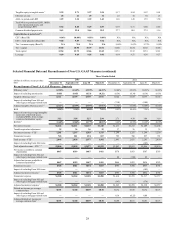
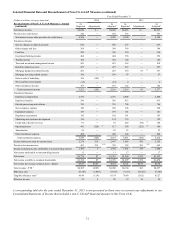
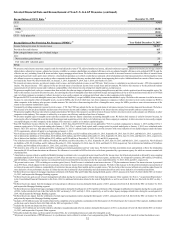
* : See Table 1 in this MD&A for a reconcilement of non-U.S.
GAAP measures and additional information
Our prior year results included several matters of a non-core
nature that were separately disclosed in Forms 8-K. See
additional detail and the resulting impacts that these Form 8-K
and other legacy mortgage-related items had on our 2014
financial results in Table 1, "Selected Financial Data and
Reconcilement of Non-U.S. GAAP Measures," in this MD&A.
Total revenue for 2015 declined $131 million compared to
2014. Excluding the gain on sale of RidgeWorth that impacted
2014 results, total revenue declined $26 million due to lower net
interest income, driven primarily by the decline in commercial
loan swap income and lower earning asset yields, as well as
foregone RidgeWorth investment management income. These
year-over-year reductions were offset partially by earning asset
growth, higher investment banking and mortgage production
income, gains from the sale of investment securities, and modest
growth in other noninterest income categories in 2015, compared
to 2014. Excluding the 2014 gain on sale of RidgeWorth,
noninterest income for 2015 increased $50 million, or 2%,
compared to 2014. See Table 1, "Selected Financial Data and
Reconcilement of Non-U.S. GAAP Measures," in this MD&A
for reconciliations of total adjusted revenue and adjusted
noninterest income.
Looking ahead, we expect first quarter net interest margin
to improve two to five basis points relative to the fourth quarter
of 2015. We will continue to carefully manage the duration of
our overall balance sheet in light of the current low interest rate
environment, while also ensuring our balance sheet is structured
to benefit from potential increases in short-term rates. See
additional discussion related to revenue, noninterest income, and
net interest income and margin in the "Noninterest Income" and
"Net Interest Income/Margin" sections of this MD&A. Also in
this MD&A, see Table 22, "Net Interest Income Asset
Sensitivity," for an analysis of potential changes in net interest
income due to instantaneous moves in benchmark interest rates.
Noninterest expense decreased $383 million, or 7%,
compared to 2014, driven primarily by $324 million of legacy
mortgage-related operating losses that were recognized in 2014.
The remainder of the decline was driven by the sale of
RidgeWorth in 2014 and the associated reduction of expenses
thereafter, as well as our continued focus on expense
management. Noninterest expense for 2015 decreased $59
million, or 1%, compared to 2014 adjusted noninterest expense.
See additional discussion related to noninterest expense in the
"Noninterest Expense" section of this MD&A. Also see Table 1,
"Selected Financial Data and Reconcilement of Non-U.S. GAAP
Measures," in this MD&A for additional information regarding,
and a reconciliation of, adjusted noninterest expense.
During 2015, our efficiency ratio improved to 63.1% from
66.7% in 2014. Our tangible efficiency ratio also improved in
2015 to 62.6%, which was better than our 2015 target, and also
better than our 2014 tangible efficiency and adjusted tangible
efficiency ratios of 66.4% and 63.3%, respectively, despite the
significant headwinds from a declining net interest margin. For
2016, we are targeting revenue growth that exceeds expense
growth, and thus, an improved tangible efficiency ratio relative
to 2015. We expect the pace of improvement will be slower than
previous years, as our core expenses have already declined
substantially, and the operating environment, while improving