SunTrust 2015 Annual Report Download - page 146
Download and view the complete annual report
Please find page 146 of the 2015 SunTrust annual report below. You can navigate through the pages in the report by either clicking on the pages listed below, or by using the keyword search tool below to find specific information within the annual report.-
 1
1 -
2
-
3
-
4
-
5
-
6
-
7
-
8
-
9
-
10
-
11
-
12
-
13
-
14
-
15
-
16
-
17
-
18
-
19
-
20
-
21
-
22
-
23
-
24
-
25
-
26
-
27
-
28
-
29
-
30
-
31
-
32
-
33
-
34
-
35
-
36
-
37
-
38
-
39
-
40
-
41
-
42
-
43
-
44
-
45
-
46
-
47
-
48
-
49
-
50
-
51
-
52
-
53
-
54
-
55
-
56
-
57
-
58
-
59
-
60
-
61
-
62
-
63
-
64
-
65
-
66
-
67
-
68
-
69
-
70
-
71
-
72
-
73
-
74
-
75
-
76
-
77
-
78
-
79
-
80
-
81
-
82
-
83
-
84
-
85
-
86
-
87
-
88
-
89
-
90
-
91
-
92
-
93
-
94
-
95
-
96
-
97
-
98
-
99
-
100
-
101
-
102
-
103
-
104
-
105
-
106
-
107
-
108
-
109
-
110
-
111
-
112
-
113
-
114
-
115
-
116
-
117
-
118
-
119
-
120
-
121
-
122
-
123
-
124
-
125
-
126
-
127
-
128
-
129
-
130
-
131
-
132
-
133
-
134
-
135
-
 136
136 -
 137
137 -
 138
138 -
 139
139 -
 140
140 -
 141
141 -
 142
142 -
 143
143 -
 144
144 -
 145
145 -
 146
146 -
 147
147 -
 148
148 -
 149
149 -
 150
150 -
 151
151 -
 152
152 -
 153
153 -
 154
154 -
 155
155 -
 156
156 -
157
-
158
-
159
-
160
-
161
-
162
-
163
-
164
-
165
-
166
-
167
-
168
-
169
-
170
-
171
-
172
-
173
-
174
-
175
-
176
-
177
-
178
-
179
-
180
-
181
-
182
-
183
-
184
-
185
-
186
-
187
-
188
-
189
-
190
-
191
-
192
-
193
-
194
-
195
-
196
 |
 |

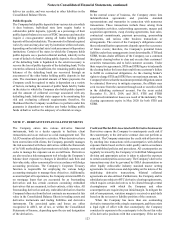
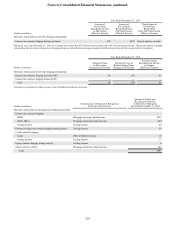
Notes to Consolidated Financial Statements, continued
118
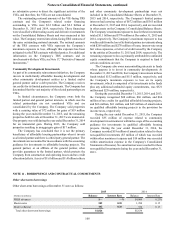
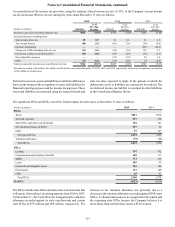
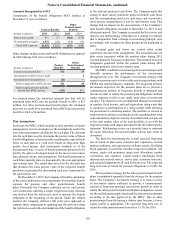
Amounts Recognized in AOCI
Components of the benefit obligations AOCI balance at
December 31 were as follows:
Pension Benefits
Other
Postretirement
Benefits
(Dollars in millions) 2015 2014 2015 2014
Prior service credit $— $— ($64) ($70)
Net actuarial loss/(gain) 1,072 1,021 (11) (14)
Total AOCI, pre-tax $1,072 $1,021 ($75) ($84)
Other changes in plan assets and benefit obligations recognized
in AOCI during 2015 were as follows:
(Dollars in millions)
Pension
Benefits
Other
Postretirement
Benefits
Current year actuarial loss $72 $3
Amortization of prior service credit — 6
Amortization of actuarial loss (21) —
Total recognized in AOCI, pre-tax $51 $9
Total recognized in net periodic
benefit and AOCI, pre-tax ($13) $—
For pension plans, the estimated actuarial loss that will be
amortized from AOCI into net periodic benefit in 2016 is $25
million. For other postretirement benefit plans, the estimated
prior service credit to be amortized from AOCI into net periodic
benefit in 2016 is $6 million.
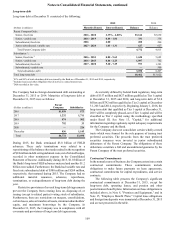
Plan Assumptions
Each year, the SBFC, which includes several members of senior
management, reviews and approves the assumptions used in the
year-end measurement calculations for each plan. The discount
rate for each plan, used to determine the present value of future
benefit obligations, is determined by matching the expected cash
flows of each plan to a yield curve based on long-term, high
quality fixed income debt instruments available as of the
measurement date. A series of benefit payments projected to be
paid by the plan is developed based on the most recent census
data, plan provisions, and assumptions. The benefit payments at
each future maturity date are discounted by the year-appropriate
spot interest rates. The model then solves for the discount rate
that produces the same present value of the projected benefit
payments as generated by discounting each year’s payments by
the spot interest rate.
On December 31, 2015, the Company refined the calculation
of the service and interest cost components of net periodic benefit
expense for pension and other postretirement benefit
plans. Previously the Company estimated service and interest
cost components utilizing a single weighted-average discount
rate derived from the yield curve used to measure the benefit
obligation at the beginning of the period. Under the refined
method, the Company utilized a full yield curve approach to
estimate these components by applying specific spot rates along
the yield curve used in the determination of the benefit obligation
to the relevant projected cash flows. The Company made this
change to more closely match the projected benefit cash flows
and the corresponding yield curve spot rates, and to provide a
more precise measurement of service and interest costs. This
change had no impact on the measurement of the Company’s
total benefit obligations recorded at December 31, 2015 or any
other prior period. The Company accounted for this service and
interest cost methodology refinement as a change in estimate
that is inseparable from a change in accounting principle, and,
accordingly, will recognize its effect prospectively beginning in
2016.
Actuarial gains and losses are created when actual
experience deviates from assumptions. The actuarial losses on
plan assets generated within the pension plans during 2015
resulted primarily from asset experience. The actuarial losses on
obligations generated within the pension plans during 2014
resulted primarily from lower interest rates.
The SBFC establishes investment policies and strategies and
formally monitors the performance of the investments
throughout the year. The Company’s investment strategy with
respect to pension assets is to invest the assets in accordance with
ERISA and related fiduciary standards. The long-term primary
investment objectives for the pension plans are to provide a
commensurate amount of long-term growth of principal and
income in order to satisfy the pension plan obligations without
undue exposure to risk in any single asset class or investment
category. The objectives are accomplished through investments
in equities, fixed income, and cash equivalents using a mix that
is conducive to participation in a rising market while allowing
for protection in a declining market. The portfolio is viewed as
long-term in its entirety, avoiding decisions regarding short-term
concerns and any single investment. Asset allocation, as a percent
of the total market value of the total portfolio, is set with the
target percentages and ranges presented in the investment policy
statement. Rebalancing occurs on a periodic basis to maintain
the target allocation, but normal market activity may result in
deviations.
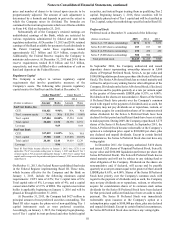
The basis for determining the overall expected long-term
rate of return on plan assets considers past experience, current
market conditions, and expectations on future trends. A building
block approach is used that considers long-term inflation, real
returns, equity risk premiums, target asset allocations, market
corrections, and expenses. Capital market simulations from
internal and external sources, survey data, economic forecasts,
and actuarial judgment are all used in this process. The expected
long-term rate of return for pension obligations is 6.68% for
2016.
The investment strategy for the other postretirement benefit
plans is maintained separately from the strategy for the pension
plans. The Company’s investment strategy is to create a series
of investment returns sufficient to provide a commensurate
amount of long-term principal and income growth in order to
satisfy the other postretirement benefit plan's obligations. Assets
are diversified among equity funds and fixed income investments
according to the mix approved by the SBFC. Due to other
postretirement benefits having a shorter time horizon, a lower
equity profile is appropriate. The expected long-term rate of
return for other postretirement benefits is 3.13% for 2016.