SunTrust 2015 Annual Report Download - page 162
Download and view the complete annual report
Please find page 162 of the 2015 SunTrust annual report below. You can navigate through the pages in the report by either clicking on the pages listed below, or by using the keyword search tool below to find specific information within the annual report.-
 1
1 -
2
-
3
-
4
-
5
-
6
-
7
-
8
-
9
-
10
-
11
-
12
-
13
-
14
-
15
-
16
-
17
-
18
-
19
-
20
-
21
-
22
-
23
-
24
-
25
-
26
-
27
-
28
-
29
-
30
-
31
-
32
-
33
-
34
-
35
-
36
-
37
-
38
-
39
-
40
-
41
-
42
-
43
-
44
-
45
-
46
-
47
-
48
-
49
-
50
-
51
-
52
-
53
-
54
-
55
-
56
-
57
-
58
-
59
-
60
-
61
-
62
-
63
-
64
-
65
-
66
-
67
-
68
-
69
-
70
-
71
-
72
-
73
-
74
-
75
-
76
-
77
-
78
-
79
-
80
-
81
-
82
-
83
-
84
-
85
-
86
-
87
-
88
-
89
-
90
-
91
-
92
-
93
-
94
-
95
-
96
-
97
-
98
-
99
-
100
-
101
-
102
-
103
-
104
-
105
-
106
-
107
-
108
-
109
-
110
-
111
-
112
-
113
-
114
-
115
-
116
-
117
-
118
-
119
-
120
-
121
-
122
-
123
-
124
-
125
-
126
-
127
-
128
-
129
-
130
-
131
-
132
-
133
-
134
-
135
-
136
-
137
-
138
-
139
-
140
-
141
-
142
-
143
-
144
-
145
-
146
-
147
-
148
-
149
-
150
-
151
-
 152
152 -
 153
153 -
 154
154 -
 155
155 -
 156
156 -
 157
157 -
 158
158 -
 159
159 -
 160
160 -
 161
161 -
 162
162 -
 163
163 -
 164
164 -
 165
165 -
 166
166 -
 167
167 -
 168
168 -
 169
169 -
 170
170 -
 171
171 -
 172
172 -
173
-
174
-
175
-
176
-
177
-
178
-
179
-
180
-
181
-
182
-
183
-
184
-
185
-
186
-
187
-
188
-
189
-
190
-
191
-
192
-
193
-
194
-
195
-
196
 |
 |

Notes to Consolidated Financial Statements, continued
134
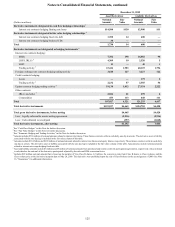
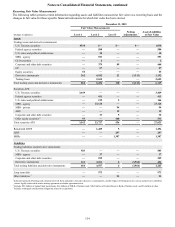
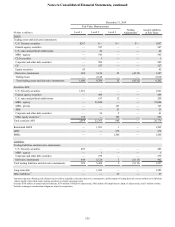
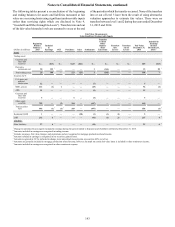
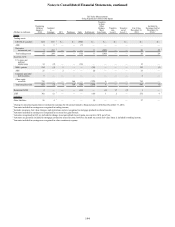
Recurring Fair Value Measurements
The following tables present certain information regarding assets and liabilities measured at fair value on a recurring basis and the
changes in fair value for those specific financial instruments for which fair value has been elected.
December 31, 2015
Fair Value Measurements
(Dollars in millions) Level 1 Level 2 Level 3
Netting
Adjustments 1Assets/Liabilities
at Fair Value
Assets
Trading assets and derivative instruments:
U.S. Treasury securities $538 $— $— $— $538
Federal agency securities — 588 — — 588
U.S. states and political subdivisions — 30 — — 30
MBS - agency — 553 — — 553
CLO securities — 2 — — 2
Corporate and other debt securities — 379 89 — 468
CP — 67 — — 67
Equity securities 66 — — — 66
Derivative instruments 262 4,182 21 (3,313) 1,152
Trading loans — 2,655 — — 2,655
Total trading assets and derivative instruments 866 8,456 110 (3,313) 6,119
Securities AFS:
U.S. Treasury securities 3,449 — — — 3,449
Federal agency securities — 411 — — 411
U.S. states and political subdivisions — 159 5 — 164
MBS - agency — 23,124 — — 23,124
MBS - private — — 94 — 94
ABS — — 12 — 12
Corporate and other debt securities — 33 5 — 38
Other equity securities 293 — 440 — 533
Total securities AFS 3,542 23,727 556 — 27,825
Residential LHFS — 1,489 5 — 1,494
LHFI — — 257 — 257
MSRs — — 1,307 — 1,307
Liabilities
Trading liabilities and derivative instruments:
U.S. Treasury securities 503 — — — 503
MBS - agency — 37 — — 37
Corporate and other debt securities — 259 — — 259
Derivative instruments 161 4,261 6 (3,964) 464
Total trading liabilities and derivative instruments 664 4,557 6 (3,964) 1,263
Long-term debt — 973 — — 973
Other liabilities 3— — 23 — 23
1 Amounts represent offsetting cash collateral received from, and paid to, the same derivative counterparties, and the impact of netting derivative assets and derivative liabilities
when a legally enforceable master netting agreement or similar agreement exists.
2 Includes $93 million of mutual fund investments, $32 million of FHLB of Atlanta stock, $402 million of Federal Reserve Bank of Atlanta stock, and $6 million of other.
3 Includes contingent consideration obligations related to acquisitions.