SunTrust 2015 Annual Report Download - page 85
Download and view the complete annual report
Please find page 85 of the 2015 SunTrust annual report below. You can navigate through the pages in the report by either clicking on the pages listed below, or by using the keyword search tool below to find specific information within the annual report.-
 1
1 -
2
-
3
-
4
-
5
-
6
-
7
-
8
-
9
-
10
-
11
-
12
-
13
-
14
-
15
-
16
-
17
-
18
-
19
-
20
-
21
-
22
-
23
-
24
-
25
-
26
-
27
-
28
-
29
-
30
-
31
-
32
-
33
-
34
-
35
-
36
-
37
-
38
-
39
-
40
-
41
-
42
-
43
-
44
-
45
-
46
-
47
-
48
-
49
-
50
-
51
-
52
-
53
-
54
-
55
-
56
-
57
-
58
-
59
-
60
-
61
-
62
-
63
-
64
-
65
-
66
-
67
-
68
-
69
-
70
-
71
-
72
-
73
-
74
-
 75
75 -
 76
76 -
 77
77 -
 78
78 -
 79
79 -
 80
80 -
 81
81 -
 82
82 -
 83
83 -
 84
84 -
 85
85 -
 86
86 -
 87
87 -
 88
88 -
 89
89 -
 90
90 -
 91
91 -
 92
92 -
 93
93 -
 94
94 -
 95
95 -
96
-
97
-
98
-
99
-
100
-
101
-
102
-
103
-
104
-
105
-
106
-
107
-
108
-
109
-
110
-
111
-
112
-
113
-
114
-
115
-
116
-
117
-
118
-
119
-
120
-
121
-
122
-
123
-
124
-
125
-
126
-
127
-
128
-
129
-
130
-
131
-
132
-
133
-
134
-
135
-
136
-
137
-
138
-
139
-
140
-
141
-
142
-
143
-
144
-
145
-
146
-
147
-
148
-
149
-
150
-
151
-
152
-
153
-
154
-
155
-
156
-
157
-
158
-
159
-
160
-
161
-
162
-
163
-
164
-
165
-
166
-
167
-
168
-
169
-
170
-
171
-
172
-
173
-
174
-
175
-
176
-
177
-
178
-
179
-
180
-
181
-
182
-
183
-
184
-
185
-
186
-
187
-
188
-
189
-
190
-
191
-
192
-
193
-
194
-
195
-
196
 |
 |
57
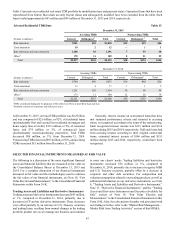
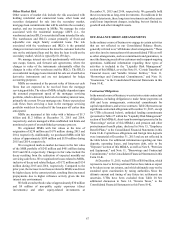
recognized $140 million in net gains through earnings related to
trading and derivative assets and liabilities classified as level 3,
primarily due to $153 million in IRLC related gains offset by
$13 million in net losses from trading securities. See Note 18,
“Fair Value Election and Measurement,” to the Consolidated
Financial Statements in this Form 10-K for a detailed discussion
regarding level 2 and 3 securities and valuation methodologies
for each class of securities.
Goodwill
At December 31, 2015, our reporting units with goodwill
balances were Consumer Banking/ Private Wealth Management
and Wholesale Banking. See Note 20, "Business Segment
Reporting," to the Consolidated Financial Statements in this
Form 10-K for further discussion of our reportable segments. We
conduct a goodwill impairment test at the reporting unit level at
least annually or more frequently as events occur or
circumstances change that would more-likely-than-not reduce
the fair value of a reporting unit below its carrying amount. In
the third quarter of 2015, we elected to prospectively change the
date of our annual goodwill impairment test from September 30
to October 1 to better align the timing of the assessment with the
availability of key inputs. We performed an impairment analysis
as of September 30, 2015, noting that the inputs utilized in the
September 30 analysis were the same inputs that were utilized
in the analysis as of October 1. Based on our annual goodwill
impairment test at October 1, 2015, September 30, 2014, and
September 30, 2013, we determined that each of our reporting
units' fair values were in excess of their respective carrying
values; therefore, no goodwill impairment was recognized. We
also performed an interim goodwill analysis for the Wholesale
reporting unit as of December 31, 2014, noting no goodwill
impairment. Our analysis as of October 1, 2015 indicates that
Wholesale Banking’s fair value in excess of its carrying value
increased modestly relative to December 31, 2014.
In the analysis as of October 1, 2015, the carrying value of
equity of the reporting units, as well as Corporate Other, was
determined by allocating our total equity to each reporting unit
based on RWA using our actual Tier 1 capital ratio as of the
measurement date. Tier 1 capital was utilized as it most closely
aligns with equity as reported under U.S. GAAP. Appropriate
adjustments were made to each reporting unit’s allocation using
Tier 1 capital to conform with U.S. GAAP equity, namely for
equity tied to goodwill and other intangible assets. Prior to 2015,
the reporting units’ carrying values were based on an equal
weighting of regulatory capital and tangible equity relative to
tangible assets. We moved to an approach based solely on
regulatory capital as we view that approach to be a more objective
measurement of the equity that a market participant would
require to operate the reporting units.
The goodwill impairment analysis estimates the fair value
of equity using discounted cash flow analyses. The inputs and
assumptions specific to each reporting unit are incorporated in
the valuations, including projections of future cash flows,
discount rates, and an estimated long-term growth rate. We assess
the reasonableness of the estimated fair value of the reporting
units by comparing implied valuation multiples with valuation
multiples from guideline companies and by comparing the
aggregate estimated fair value of the reporting units to our market
capitalization over a reasonable period of time. Significant and
sustained declines in our market capitalization could be an
indication of potential goodwill impairment.
Multi-year financial forecasts are developed for each
reporting unit by considering several key business drivers such
as new business initiatives, client service and retention standards,
market share changes, anticipated loan and deposit growth,
forward interest rates, historical performance, and industry and
economic trends, among other considerations that a market
participant would consider in valuing the reporting units.
Discount rates are estimated based on the Capital Asset Pricing
Model, which considers the risk-free interest rate, market risk
premium, beta, size premiums, and idiosyncratic risk
adjustments specific to a particular reporting unit. The discount
rates are also calibrated based on risks related to the projected
cash flows of each reporting unit.
The estimated fair values of the reporting units are highly
sensitive to changes in these estimates and assumptions;
therefore, in some instances, changes in these assumptions could
impact whether the fair value of a reporting unit is greater than
its carrying value. We perform sensitivity analyses around these
assumptions in order to assess the reasonableness of the
assumptions, and the resulting estimated fair values. Ultimately,
future potential changes in these assumptions may impact the
estimated fair value of a reporting unit and cause the fair value
of the reporting unit to be below its carrying value. Additionally,
the carrying value of a reporting unit's equity could change based
on market conditions, asset growth, preferred stock issuances,
or the risk profile of those reporting units, which could impact
whether or not the fair value of a reporting unit is less than
carrying value.
Income Taxes
We are subject to the income tax laws of the U.S., its states and
municipalities where we conduct business. We estimate income
tax expense based on amounts expected to be owed to these
various tax jurisdictions. The estimated income tax expense or
benefit is reported in the Consolidated Statements of Income.
Accrued taxes represent the net estimated amount due to or
to be received from tax jurisdictions either currently or in the
future and are reported in other liabilities on the Consolidated
Balance Sheets. In estimating accrued taxes, we assess the
appropriate tax treatment of transactions and filing positions
after considering statutes, regulations, judicial precedent, and
other pertinent information. The income tax laws are complex
and subject to different interpretations by the taxpayer and the
relevant government taxing authorities. Significant judgment is
required in determining the tax accruals and in evaluating our
tax positions, including evaluating uncertain tax positions.
Changes in the estimate of accrued taxes occur periodically due
to changes in tax rates, interpretations of tax laws, the status of
examinations by the tax authorities, and newly enacted statutory,
judicial, and regulatory guidance that could impact the relative
merits and risks of tax positions. These changes, when they occur,
impact tax expense and can materially affect our operating
results. We review our tax positions quarterly and make
adjustments to accrued taxes as new information becomes
available.
Deferred income tax assets represent amounts available to
reduce income taxes payable in future years. Such assets arise
due to temporary differences between the financial reporting and