SunTrust 2015 Annual Report Download - page 180
Download and view the complete annual report
Please find page 180 of the 2015 SunTrust annual report below. You can navigate through the pages in the report by either clicking on the pages listed below, or by using the keyword search tool below to find specific information within the annual report.-
 1
1 -
2
-
3
-
4
-
5
-
6
-
7
-
8
-
9
-
10
-
11
-
12
-
13
-
14
-
15
-
16
-
17
-
18
-
19
-
20
-
21
-
22
-
23
-
24
-
25
-
26
-
27
-
28
-
29
-
30
-
31
-
32
-
33
-
34
-
35
-
36
-
37
-
38
-
39
-
40
-
41
-
42
-
43
-
44
-
45
-
46
-
47
-
48
-
49
-
50
-
51
-
52
-
53
-
54
-
55
-
56
-
57
-
58
-
59
-
60
-
61
-
62
-
63
-
64
-
65
-
66
-
67
-
68
-
69
-
70
-
71
-
72
-
73
-
74
-
75
-
76
-
77
-
78
-
79
-
80
-
81
-
82
-
83
-
84
-
85
-
86
-
87
-
88
-
89
-
90
-
91
-
92
-
93
-
94
-
95
-
96
-
97
-
98
-
99
-
100
-
101
-
102
-
103
-
104
-
105
-
106
-
107
-
108
-
109
-
110
-
111
-
112
-
113
-
114
-
115
-
116
-
117
-
118
-
119
-
120
-
121
-
122
-
123
-
124
-
125
-
126
-
127
-
128
-
129
-
130
-
131
-
132
-
133
-
134
-
135
-
136
-
137
-
138
-
139
-
140
-
141
-
142
-
143
-
144
-
145
-
146
-
147
-
148
-
149
-
150
-
151
-
152
-
153
-
154
-
155
-
156
-
157
-
158
-
159
-
160
-
161
-
162
-
163
-
164
-
165
-
166
-
167
-
168
-
169
-
 170
170 -
 171
171 -
 172
172 -
 173
173 -
 174
174 -
 175
175 -
 176
176 -
 177
177 -
 178
178 -
 179
179 -
 180
180 -
 181
181 -
 182
182 -
 183
183 -
 184
184 -
 185
185 -
 186
186 -
 187
187 -
 188
188 -
 189
189 -
 190
190 -
191
-
192
-
193
-
194
-
195
-
196
 |
 |
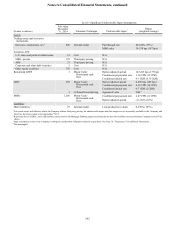
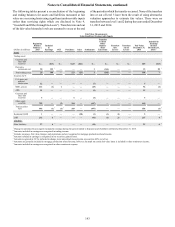
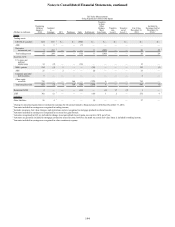
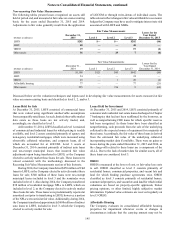
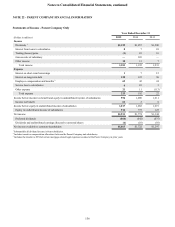
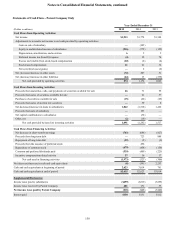
Notes to Consolidated Financial Statements, continued
152
financial performance was reported in the Wholesale Banking
segment. See Note 2, "Acquisitions/Dispositions," for additional
information related to the sale of RidgeWorth.
Because the business segment results are presented based on
management accounting practices, the transition to the
consolidated results, which are prepared under U.S. GAAP,
creates certain differences which are reflected in Reconciling
Items. Business segment reporting conventions are described
below.
• Net interest income – Net interest income is presented on
an FTE basis to make income from tax-exempt assets
comparable to other taxable products. The segment results
reflect matched maturity funds transfer pricing, which
ascribes credits or charges based on the economic value or
cost created by the assets and liabilities of each segment.
The mismatch between funds credits and funds charges at
the segment level resides in Reconciling Items. The change
in this mismatch is generally attributable to corporate
balance sheet management strategies.
• Provision/(benefit) for credit losses – Represents net
charge-offs by segment combined with an allocation to the
segments of the provision/(benefit) attributable to each
segment's quarterly change in the ALLL and unfunded
commitments reserve balances.
• Provision/(benefit) for income taxes – Calculated using a
blended income tax rate for each segment. This calculation
includes the impact of various adjustments, such as the
reversal of the FTE gross up on tax-exempt assets, tax
adjustments, and credits that are unique to each segment.
The difference between the calculated provision/(benefit)
for income taxes at the segment level and the consolidated
provision/(benefit) for income taxes is reported in
Reconciling Items.
The segment’s financial performance is comprised of direct
financial results, as well as various allocations that for internal
management reporting purposes provide an enhanced view of
the segment’s financial performance. The internal allocations
include the following:
• Operational costs – Expenses are charged to the segments
based on various statistical volumes multiplied by activity
based cost rates. As a result of the activity based costing
process, residual expenses are also allocated to the
segments. The recoveries for the majority of these costs are
reported in Corporate Other.
• Support and overhead costs – Expenses not directly
attributable to a specific segment are allocated based on
various drivers (e.g., number of equivalent employees,
number of PCs/Laptops, and net revenue). The recoveries
for these allocations are reported in Corporate Other.
• Sales and referral credits – Segments may compensate
another segment for referring or selling certain products.
The majority of the revenue resides in the segment where
the product is ultimately managed.
The application and development of management reporting
methodologies is a dynamic process and is subject to periodic
enhancements. The implementation of these enhancements to
the internal management reporting methodology may materially
affect the results disclosed for each segment, with no impact on
consolidated results. Whenever significant changes to
management reporting methodologies take place, the impact of
these changes is quantified and prior period information is
reclassified wherever practicable.