SunTrust 2015 Annual Report Download - page 62
Download and view the complete annual report
Please find page 62 of the 2015 SunTrust annual report below. You can navigate through the pages in the report by either clicking on the pages listed below, or by using the keyword search tool below to find specific information within the annual report.-
 1
1 -
2
-
3
-
4
-
5
-
6
-
7
-
8
-
9
-
10
-
11
-
12
-
13
-
14
-
15
-
16
-
17
-
18
-
19
-
20
-
21
-
22
-
23
-
24
-
25
-
26
-
27
-
28
-
29
-
30
-
31
-
32
-
33
-
34
-
35
-
36
-
37
-
38
-
39
-
40
-
41
-
42
-
43
-
44
-
45
-
46
-
47
-
48
-
49
-
50
-
51
-
 52
52 -
 53
53 -
 54
54 -
 55
55 -
 56
56 -
 57
57 -
 58
58 -
 59
59 -
 60
60 -
 61
61 -
 62
62 -
 63
63 -
 64
64 -
 65
65 -
 66
66 -
 67
67 -
 68
68 -
 69
69 -
 70
70 -
 71
71 -
 72
72 -
73
-
74
-
75
-
76
-
77
-
78
-
79
-
80
-
81
-
82
-
83
-
84
-
85
-
86
-
87
-
88
-
89
-
90
-
91
-
92
-
93
-
94
-
95
-
96
-
97
-
98
-
99
-
100
-
101
-
102
-
103
-
104
-
105
-
106
-
107
-
108
-
109
-
110
-
111
-
112
-
113
-
114
-
115
-
116
-
117
-
118
-
119
-
120
-
121
-
122
-
123
-
124
-
125
-
126
-
127
-
128
-
129
-
130
-
131
-
132
-
133
-
134
-
135
-
136
-
137
-
138
-
139
-
140
-
141
-
142
-
143
-
144
-
145
-
146
-
147
-
148
-
149
-
150
-
151
-
152
-
153
-
154
-
155
-
156
-
157
-
158
-
159
-
160
-
161
-
162
-
163
-
164
-
165
-
166
-
167
-
168
-
169
-
170
-
171
-
172
-
173
-
174
-
175
-
176
-
177
-
178
-
179
-
180
-
181
-
182
-
183
-
184
-
185
-
186
-
187
-
188
-
189
-
190
-
191
-
192
-
193
-
194
-
195
-
196
 |
 |

34
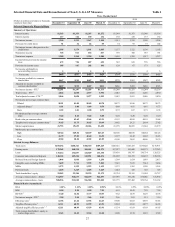
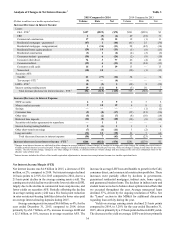
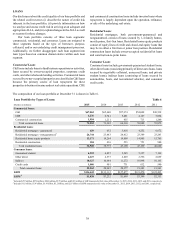
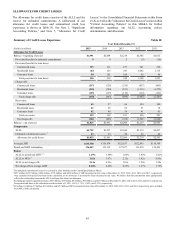
Analysis of Changes in Net Interest Income 1Table 3
2015 Compared to 2014 2014 Compared to 2013
(Dollars in millions on a taxable-equivalent basis) Volume Rate Net Volume Rate Net
Increase/(Decrease) in Interest Income:
Loans:
C&I - FTE 2$157 ($229) ($72) $241 ($238) $3
CRE 1 (5) (4) 49 (18) 31
Commercial construction 17 (2) 15 12 (1) 11
Residential mortgages - guaranteed (47) 1 (46) (61) 25 (36)
Residential mortgages - nonguaranteed 3 (34) (31) 28 (42) (14)
Residential home equity products (29) 18 (11) (5) (8) (13)
Residential construction (3) 1 (2) (4) (2) (6)
Consumer student - guaranteed (30) 6 (24) (2) (8) (10)
Consumer other direct 74 3 77 46 (4) 42
Consumer indirect (39) 6 (33) 13 (24) (11)
Consumer credit cards 16 3 19 13 — 13
Nonaccrual (10) 10 — (10) (1) (11)
Securities AFS:
Taxable 61 (77) (16) 34 — 34
Tax-exempt - FTE 2(4) — (4) — — —
LHFS - FTE 210 (5) 5 (38) 9 (29)
Interest earning trading assets 19 (11) 8 (3) 10 7
Total increase/(decrease) in interest income - FTE 2196 (315) (119) 313 (302) 11
Increase/(Decrease) in Interest Expense:
NOW accounts 6 3 9 2 3 5
Money market accounts 9 10 19 4 8 12
Savings — — — — (1) (1)
Consumer time (9) (8) (17) (15) (21) (36)
Other time (5) (2) (7) (8) (10) (18)
Brokered time deposits (12) (8) (20) (10) (8) (18)
Securities sold under agreements to repurchase — 1 1 — — —
Interest-bearing trading liabilities 2 (1) 1 3 1 4
Other short-term borrowings (7) (4) (11) 3 (2) 1
Long-term debt (34) 16 (18) 53 7 60
Total (decrease)/increase in interest expense (50) 7 (43) 32 (23) 9
Increase/(decrease) in net interest income - FTE 2$246 ($322) ($76) $281 ($279) $2
1 Changes in net interest income are attributed to either changes in average balances (volume change) or changes in average rates (rate change) for earning assets and sources
of funds on which interest is received or paid. Volume change is calculated as change in volume times the previous rate, while rate change is change in rate times the previous
volume. The rate/volume change, change in rate times change in volume, is allocated between volume change and rate change at the ratio each component bears to the
absolute value of their total.
2 Interest income includes the effects of the taxable-equivalent adjustments to increase tax-exempt interest income to a taxable-equivalent basis.
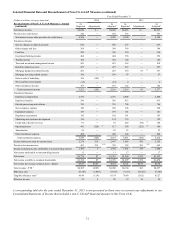
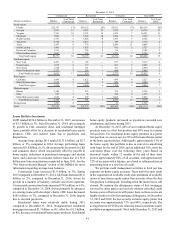
Net Interest Income/Margin (FTE)
Net interest income was $4.9 billion in 2015, a decrease of $76
million, or 2%, compared to 2014. Net interest margin declined
16 basis points to 2.91% for 2015 compared to 2014, due to a
21 basis point decline in the average earning assets yield. The
earning assets yield decline was driven by lower yields on LHFI,
largely due to the decline in commercial loan swap income, and
lower yields on securities AFS. Partially offsetting the decline
in average earning assets yield was a five basis point reduction
in rates on interest-bearing liabilities driven by lower rates paid
on average interest-bearing deposits during 2015.
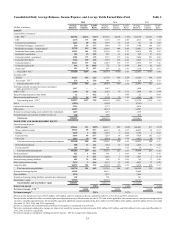
Average earning assets increased $6.6 billion, or 4%, for the
year ended December 31, 2015, compared to 2014, driven
primarily by a $2.7 billion, or 2%, increase in average LHFI and
a $2.5 billion, or 10%, increase in average securities AFS. The
increase in average LHFI was attributable to growth in the C&I,
consumer direct, and commercial construction portfolios. These
increases were partially offset by declines in government-
guaranteed residential mortgages, indirect auto, home equity,
and guaranteed student loans. The declines in indirect auto and
student loans were due to balance sheet optimization efforts that
we executed throughout the year. Average nonaccrual loans
declined 37%, driven by the ongoing resolution of NPLs. See
the "Loans" section in this MD&A for additional discussion
regarding loan activity during the year.
Yields on average earning assets declined 21 basis points
compared to 2014, to 3.20% for the year ended December 31,
2015, driven primarily by a 15 basis point decline in LHFI yields.
The decrease in the yield on average LHFI was driven primarily