SunTrust 2015 Annual Report Download - page 95
Download and view the complete annual report
Please find page 95 of the 2015 SunTrust annual report below. You can navigate through the pages in the report by either clicking on the pages listed below, or by using the keyword search tool below to find specific information within the annual report.-
 1
1 -
2
-
3
-
4
-
5
-
6
-
7
-
8
-
9
-
10
-
11
-
12
-
13
-
14
-
15
-
16
-
17
-
18
-
19
-
20
-
21
-
22
-
23
-
24
-
25
-
26
-
27
-
28
-
29
-
30
-
31
-
32
-
33
-
34
-
35
-
36
-
37
-
38
-
39
-
40
-
41
-
42
-
43
-
44
-
45
-
46
-
47
-
48
-
49
-
50
-
51
-
52
-
53
-
54
-
55
-
56
-
57
-
58
-
59
-
60
-
61
-
62
-
63
-
64
-
65
-
66
-
67
-
68
-
69
-
70
-
71
-
72
-
73
-
74
-
75
-
76
-
77
-
78
-
79
-
80
-
81
-
82
-
83
-
84
-
 85
85 -
 86
86 -
 87
87 -
 88
88 -
 89
89 -
 90
90 -
 91
91 -
 92
92 -
 93
93 -
 94
94 -
 95
95 -
 96
96 -
 97
97 -
 98
98 -
 99
99 -
 100
100 -
 101
101 -
 102
102 -
 103
103 -
 104
104 -
 105
105 -
106
-
107
-
108
-
109
-
110
-
111
-
112
-
113
-
114
-
115
-
116
-
117
-
118
-
119
-
120
-
121
-
122
-
123
-
124
-
125
-
126
-
127
-
128
-
129
-
130
-
131
-
132
-
133
-
134
-
135
-
136
-
137
-
138
-
139
-
140
-
141
-
142
-
143
-
144
-
145
-
146
-
147
-
148
-
149
-
150
-
151
-
152
-
153
-
154
-
155
-
156
-
157
-
158
-
159
-
160
-
161
-
162
-
163
-
164
-
165
-
166
-
167
-
168
-
169
-
170
-
171
-
172
-
173
-
174
-
175
-
176
-
177
-
178
-
179
-
180
-
181
-
182
-
183
-
184
-
185
-
186
-
187
-
188
-
189
-
190
-
191
-
192
-
193
-
194
-
195
-
196
 |
 |
67
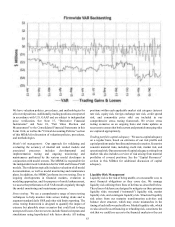
Other Market Risk
Other sources of market risk include the risk associated with
holding residential and commercial loans, other loans and
securities designated for sale into the secondary market,
mortgage loan commitments that will be sold into the secondary
market, and our investment in MSRs. We manage the risks
associated with the residential mortgage LHFS (i.e., the
warehouse) and our IRLCs on residential loans intended for sale.
The warehouses and IRLCs consist primarily of fixed and
adjustable rate single family residential loans. The risk
associated with the warehouses and IRLCs is the potential
change in interest rates between the time the customer locks the
rate on the anticipated loan and the time the loan is sold on the
secondary market, which is typically 60-150 days.
We manage interest rate risk predominantly with interest
rate swaps, futures, and forward sale agreements, where the
changes in value of the instruments substantially offset the
changes in value of the warehouse and the IRLCs. The IRLCs
on residential mortgage loans intended for sale are classified as
derivative instruments and are not designated for hedge
accounting purposes.
MSRs are measured at the present value of future net cash
flows that are expected to be received from the mortgage
servicing portfolio. The value of MSRs is highly dependent upon
the assumed prepayment speed of the mortgage servicing
portfolio, which is driven by the level of certain key interest rates,
primarily the current 30-year mortgage rate. Future expected net
cash flows from servicing a loan in the mortgage servicing
portfolio would not be realized if the loan pays off earlier than
anticipated.
MSRs are measured at fair value with a balance of $1.3
billion and $1.2 billion at December 31, 2015 and 2014,
respectively, and are managed within established risk limits and
monitored as part of an established governance process.
We originated MSRs with fair values at the time of
origination of $238 million and $178 million during 2015 and
2014, respectively. Additionally, we purchased MSRs with fair
values of approximately $109 million and $130 million during
2015 and 2014, respectively.
We recognized mark-to-market decreases in the fair value
of the MSR portfolio of $242 million and $401 million during
2015 and 2014, respectively. Changes in fair value include the
decay resulting from the realization of expected monthly net
servicing cash flows. We recognized net losses related to MSRs,
inclusive of decay and related hedges, of $172 million and $134
million during 2015 and 2014, respectively. Compared to the
prior year, the increase in net losses related to MSRs was driven
by higher decay in the current periods, resulting from increased
prepayments due to higher refinance activity given the low
interest rate environment.
We held a total net book value of approximately $30 million
and $9 million of non-public equity exposures (direct
investments) and other equity-related investments at
December 31, 2015 and 2014, respectively. We generally hold
these investments as long-term investments. If conditions in the
market deteriorate, these long-term investments and other assets
could incur impairment charges, including, but not limited to,
goodwill and other intangible assets.
OFF-BALANCE SHEET ARRANGEMENTS
In the ordinary course of business we engage in certain activities
that are not reflected in our Consolidated Balance Sheets,
generally referred to as "off-balance sheet arrangements." These
activities involve transactions with unconsolidated VIEs as well
as other arrangements, such as commitments and guarantees, to
meet the financing needs of our customers and to support ongoing
operations. Additional information regarding these types of
activities is included in the “Liquidity Risk Management”
section of this MD&A, as well as Note 10, “Certain Transfers of
Financial Assets and Variable Interest Entities,” Note 11,
“Borrowings and Contractual Commitments,” and Note 16,
“Guarantees,” to the Consolidated Financial Statements in this
Form 10-K.
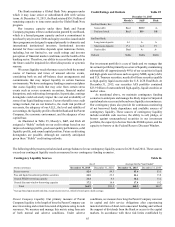
Contractual Obligations
In the normal course of business, we enter into certain contractual
obligations, including obligations to make future payments on
debt and lease arrangements, contractual commitments for
capital expenditures, and service contracts. Table 28 presents our
significant contractual obligations at December 31, 2015, except
for UTBs (discussed below), unfunded lending commitments
(presented in Table 27 within the "Liquidity Risk Management"
section of this MD&A), short-term borrowings (presented in the
"Borrowings" section of this MD&A), and pension and other
postretirement benefit plans, disclosed in Note 15, "Employee
Benefit Plans," to the Consolidated Financial Statements in this
Form 10-K. Capital lease obligations and foreign time deposits
were immaterial at December 31, 2015 and are not reflected in
the table below. For additional information regarding our time
deposits, operating leases, and long-term debt, refer to the
"Deposits" section of this MD&A, as well as Note 8, "Premises
and Equipment," and Note 11, "Borrowings and Contractual
Commitments," to the Consolidated Financial Statements in this
Form 10-K.
At December 31, 2015, we had UTBs of $100 million, which
represent a reserve for tax positions that we have taken or expect
to be taken in our tax returns, and which ultimately may not be
sustained upon examination by taxing authorities. Since the
ultimate amount and timing of any future tax settlements are
uncertain, UTBs have been excluded from Table 28. See
additional discussion in Note 14, "Income Taxes," to the
Consolidated Financial Statements in this Form 10-K.