SunTrust 2015 Annual Report Download - page 61
Download and view the complete annual report
Please find page 61 of the 2015 SunTrust annual report below. You can navigate through the pages in the report by either clicking on the pages listed below, or by using the keyword search tool below to find specific information within the annual report.-
 1
1 -
2
-
3
-
4
-
5
-
6
-
7
-
8
-
9
-
10
-
11
-
12
-
13
-
14
-
15
-
16
-
17
-
18
-
19
-
20
-
21
-
22
-
23
-
24
-
25
-
26
-
27
-
28
-
29
-
30
-
31
-
32
-
33
-
34
-
35
-
36
-
37
-
38
-
39
-
40
-
41
-
42
-
43
-
44
-
45
-
46
-
47
-
48
-
49
-
50
-
 51
51 -
 52
52 -
 53
53 -
 54
54 -
 55
55 -
 56
56 -
 57
57 -
 58
58 -
 59
59 -
 60
60 -
 61
61 -
 62
62 -
 63
63 -
 64
64 -
 65
65 -
 66
66 -
 67
67 -
 68
68 -
 69
69 -
 70
70 -
 71
71 -
72
-
73
-
74
-
75
-
76
-
77
-
78
-
79
-
80
-
81
-
82
-
83
-
84
-
85
-
86
-
87
-
88
-
89
-
90
-
91
-
92
-
93
-
94
-
95
-
96
-
97
-
98
-
99
-
100
-
101
-
102
-
103
-
104
-
105
-
106
-
107
-
108
-
109
-
110
-
111
-
112
-
113
-
114
-
115
-
116
-
117
-
118
-
119
-
120
-
121
-
122
-
123
-
124
-
125
-
126
-
127
-
128
-
129
-
130
-
131
-
132
-
133
-
134
-
135
-
136
-
137
-
138
-
139
-
140
-
141
-
142
-
143
-
144
-
145
-
146
-
147
-
148
-
149
-
150
-
151
-
152
-
153
-
154
-
155
-
156
-
157
-
158
-
159
-
160
-
161
-
162
-
163
-
164
-
165
-
166
-
167
-
168
-
169
-
170
-
171
-
172
-
173
-
174
-
175
-
176
-
177
-
178
-
179
-
180
-
181
-
182
-
183
-
184
-
185
-
186
-
187
-
188
-
189
-
190
-
191
-
192
-
193
-
194
-
195
-
196
 |
 |

33
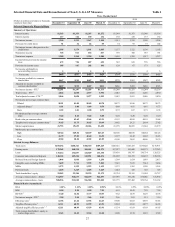
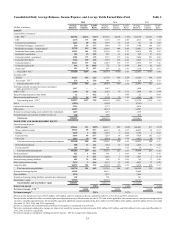
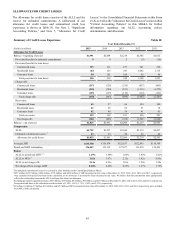
Consolidated Daily Average Balances, Income/Expense, and Average Yields Earned/Rates Paid Table 2
2015 2014 2013
(Dollars in millions) Average
Balances
Income/
Expense
Yields/
Rates
Average
Balances
Income/
Expense
Yields/
Rates
Average
Balances
Income/
Expense
Yields/
Rates
ASSETS
Loans held for investment: 1
C&I - FTE 2$65,786 $2,112 3.21% $61,181 $2,184 3.57% $54,788 $2,181 3.98%
CRE 6,178 173 2.80 6,150 177 2.88 4,513 146 3.24
Commercial construction 1,603 50 3.12 1,078 35 3.28 701 24 3.46
Residential mortgages - guaranteed 636 24 3.77 1,890 70 3.68 3,708 106 2.85
Residential mortgages - nonguaranteed 23,759 913 3.84 23,691 944 3.99 23,007 958 4.17
Residential home equity products 13,535 501 3.70 14,329 512 3.57 14,474 525 3.63
Residential construction 384 19 4.85 457 21 4.64 549 27 4.91
Consumer student - guaranteed 4,584 173 3.78 5,375 197 3.66 5,426 207 3.82
Consumer other direct 5,344 230 4.30 3,635 153 4.22 2,535 111 4.37
Consumer indirect 10,262 333 3.24 11,459 366 3.19 11,072 377 3.41
Consumer credit cards 944 94 10.00 772 75 9.64 646 62 9.66
Nonaccrual 3543 22 4.13 857 22 2.59 1,238 33 2.63
Total LHFI - FTE 2133,558 4,644 3.48 130,874 4,756 3.63 122,657 4,757 3.88
Securities AFS:
Taxable 26,327 587 2.23 23,779 603 2.54 22,383 569 2.54
Tax-exempt - FTE 2176 9 5.20 245 13 5.26 258 13 5.18
Total securities AFS - FTE 226,503 596 2.25 24,024 616 2.56 22,641 582 2.57
Fed funds sold and securities borrowed or purchased
under agreements to resell 1,147 — — 1,067 — — 1,024 — 0.02
LHFS - FTE 22,348 83 3.52 2,085 78 3.75 3,096 107 3.44
Interest-bearing deposits in other banks 22 — 0.12 31 — 0.08 21 — 0.09
Interest earning trading assets 5,235 84 1.62 4,108 76 1.86 4,289 69 1.61
Total earning assets - FTE 2168,813 5,407 3.20 162,189 5,526 3.41 153,728 5,515 3.59
ALLL (1,835) (1,995) (2,121)
Cash and due from banks 5,614 5,773 4,530
Other assets 14,527 14,674 14,287
Noninterest earning trading assets and derivative instruments 1,265 1,255 1,660
Unrealized gains on securities available for sale, net 508 280 413
Total assets $188,892 $182,176 $172,497
LIABILITIES AND SHAREHOLDERS' EQUITY
Interest-bearing deposits:
NOW accounts $35,161 $31 0.09% $28,879 $22 0.08% $26,083 $17 0.07%
Money market accounts 50,518 85 0.17 44,813 66 0.15 42,655 54 0.13
Savings 6,165 2 0.03 6,076 2 0.04 5,740 3 0.05
Consumer time 6,443 49 0.77 7,539 66 0.88 9,018 102 1.13
Other time 3,813 39 1.02 4,294 46 1.06 4,937 64 1.29
Total interest-bearing consumer and commercial deposits 102,100 206 0.20 91,601 202 0.22 88,433 240 0.27
Brokered time deposits 888 13 1.41 1,584 33 2.08 2,030 51 2.49
Foreign deposits 218 — 0.13 146 — 0.12 35 — 0.13
Total interest-bearing deposits 103,206 219 0.21 93,331 235 0.25 90,498 291 0.32
Funds purchased 822 1 0.11 931 1 0.09 639 1 0.10
Securities sold under agreements to repurchase 1,821 4 0.21 2,202 3 0.14 1,857 3 0.14
Interest-bearing trading liabilities 881 22 2.44 806 21 2.65 705 17 2.45
Other short-term borrowings 2,135 3 0.16 6,135 14 0.23 4,953 13 0.26
Long-term debt 10,873 252 2.32 12,359 270 2.19 9,872 210 2.12
Total interest-bearing liabilities 119,738 501 0.42 115,764 544 0.47 108,524 535 0.49
Noninterest-bearing deposits 42,102 40,411 38,643
Other liabilities 3,276 3,473 3,602
Noninterest-bearing trading liabilities and derivative instruments 430 358 561
Shareholders’ equity 23,346 22,170 21,167
Total liabilities and shareholders’ equity $188,892 $182,176 $172,497
Interest rate spread 2.78% 2.94% 3.10%
Net interest income - FTE 2, 4 $4,906 $4,982 $4,980
Net interest margin 52.91% 3.07% 3.24%
1 Interest income includes loan fees of $189 million, $196 million, and $153 million for the years ended December 31, 2015, 2014, and 2013, respectively.
2 Interest income includes the effects of taxable-equivalent adjustments using a federal income tax rate of 35% and, where applicable, state income taxes to increase tax-exempt interest
income to a taxable-equivalent basis. The net taxable-equivalent adjustment amounts included in the above table were $142 million, $142 million, and $127 million for the years ended
December 31, 2015, 2014, and 2013, respectively.
3 Income on consumer and residential nonaccrual loans, if recognized, is recognized on a cash basis.
4 Derivative instruments employed to manage our interest rate sensitivity increased net interest income $300 million, $419 million, and $444 million for the years ended December 31,
2015, 2014, and 2013, respectively.
5 Net interest margin is calculated by dividing net interest income – FTE by average total earning assets.