SunTrust 2015 Annual Report Download - page 68
Download and view the complete annual report
Please find page 68 of the 2015 SunTrust annual report below. You can navigate through the pages in the report by either clicking on the pages listed below, or by using the keyword search tool below to find specific information within the annual report.-
 1
1 -
2
-
3
-
4
-
5
-
6
-
7
-
8
-
9
-
10
-
11
-
12
-
13
-
14
-
15
-
16
-
17
-
18
-
19
-
20
-
21
-
22
-
23
-
24
-
25
-
26
-
27
-
28
-
29
-
30
-
31
-
32
-
33
-
34
-
35
-
36
-
37
-
38
-
39
-
40
-
41
-
42
-
43
-
44
-
45
-
46
-
47
-
48
-
49
-
50
-
51
-
52
-
53
-
54
-
55
-
56
-
57
-
 58
58 -
 59
59 -
 60
60 -
 61
61 -
 62
62 -
 63
63 -
 64
64 -
 65
65 -
 66
66 -
 67
67 -
 68
68 -
 69
69 -
 70
70 -
 71
71 -
 72
72 -
 73
73 -
 74
74 -
 75
75 -
 76
76 -
 77
77 -
 78
78 -
79
-
80
-
81
-
82
-
83
-
84
-
85
-
86
-
87
-
88
-
89
-
90
-
91
-
92
-
93
-
94
-
95
-
96
-
97
-
98
-
99
-
100
-
101
-
102
-
103
-
104
-
105
-
106
-
107
-
108
-
109
-
110
-
111
-
112
-
113
-
114
-
115
-
116
-
117
-
118
-
119
-
120
-
121
-
122
-
123
-
124
-
125
-
126
-
127
-
128
-
129
-
130
-
131
-
132
-
133
-
134
-
135
-
136
-
137
-
138
-
139
-
140
-
141
-
142
-
143
-
144
-
145
-
146
-
147
-
148
-
149
-
150
-
151
-
152
-
153
-
154
-
155
-
156
-
157
-
158
-
159
-
160
-
161
-
162
-
163
-
164
-
165
-
166
-
167
-
168
-
169
-
170
-
171
-
172
-
173
-
174
-
175
-
176
-
177
-
178
-
179
-
180
-
181
-
182
-
183
-
184
-
185
-
186
-
187
-
188
-
189
-
190
-
191
-
192
-
193
-
194
-
195
-
196
 |
 |

40
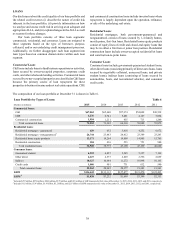
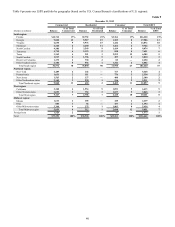
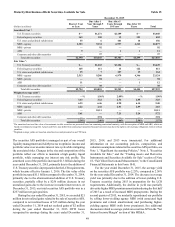
Table 9 presents our LHFI portfolio by geography (based on the U.S. Census Bureau's classifications of U.S. regions):
Table 9
December 31, 2015
Commercial Residential Consumer Total LHFI
(Dollars in millions) Balance
% of Total
Commercial Balance
% of Total
Residential Balance
% of Total
Consumer Balance
% of Total
LHFI
South region:
Florida $12,712 17% $9,752 25% $3,764 17% $26,228 19%
Georgia 9,820 13 5,917 15 1,769 8 17,506 13
Virginia 6,650 9 5,976 15 1,446 6 14,072 10
Maryland 4,220 6 4,280 11 1,262 6 9,762 7
North Carolina 4,106 5 3,549 9 1,419 6 9,074 7
Tennessee 4,710 6 2,123 5 818 4 7,651 6
Texas 3,362 4 351 1 2,592 12 6,305 5
South Carolina 1,517 2 1,796 5 497 2 3,810 3
District of Columbia 1,375 2 790 2 85 — 2,250 2
Other Southern states 4,100 5 556 1 1,346 6 6,002 4
Total South region 52,572 70 35,090 90 14,998 67 102,660 75
Northeast region:
New York 4,489 6 142 — 717 3 5,348 4
Pennsylvania 1,651 2 111 — 776 3 2,538 2
New Jersey 1,563 2 137 — 400 2 2,100 2
Other Northeastern states 2,165 3 230 1 516 2 2,911 2
Total Northeast region 9,868 13 620 2 2,409 11 12,897 9
West region:
California 3,368 4 1,954 5 1,091 5 6,413 5
Other Western states 2,059 3 752 2 1,037 5 3,848 3
Total West region 5,427 7 2,706 7 2,128 10 10,261 8
Midwest region:
Illinois 1,614 2 185 — 420 2 2,219 2
Ohio 885 1 52 — 457 2 1,394 1
Other Midwestern states 3,360 4 275 1 1,803 8 5,438 4
Total Midwest region 5,859 8 512 1 2,680 12 9,051 7
Foreign loans 1,526 2 — — 47 — 1,573 1
Total $75,252 100% $38,928 100% $22,262 100% $136,442 100%