SunTrust 2015 Annual Report Download - page 73
Download and view the complete annual report
Please find page 73 of the 2015 SunTrust annual report below. You can navigate through the pages in the report by either clicking on the pages listed below, or by using the keyword search tool below to find specific information within the annual report.-
 1
1 -
2
-
3
-
4
-
5
-
6
-
7
-
8
-
9
-
10
-
11
-
12
-
13
-
14
-
15
-
16
-
17
-
18
-
19
-
20
-
21
-
22
-
23
-
24
-
25
-
26
-
27
-
28
-
29
-
30
-
31
-
32
-
33
-
34
-
35
-
36
-
37
-
38
-
39
-
40
-
41
-
42
-
43
-
44
-
45
-
46
-
47
-
48
-
49
-
50
-
51
-
52
-
53
-
54
-
55
-
56
-
57
-
58
-
59
-
60
-
61
-
62
-
 63
63 -
 64
64 -
 65
65 -
 66
66 -
 67
67 -
 68
68 -
 69
69 -
 70
70 -
 71
71 -
 72
72 -
 73
73 -
 74
74 -
 75
75 -
 76
76 -
 77
77 -
 78
78 -
 79
79 -
 80
80 -
 81
81 -
 82
82 -
 83
83 -
84
-
85
-
86
-
87
-
88
-
89
-
90
-
91
-
92
-
93
-
94
-
95
-
96
-
97
-
98
-
99
-
100
-
101
-
102
-
103
-
104
-
105
-
106
-
107
-
108
-
109
-
110
-
111
-
112
-
113
-
114
-
115
-
116
-
117
-
118
-
119
-
120
-
121
-
122
-
123
-
124
-
125
-
126
-
127
-
128
-
129
-
130
-
131
-
132
-
133
-
134
-
135
-
136
-
137
-
138
-
139
-
140
-
141
-
142
-
143
-
144
-
145
-
146
-
147
-
148
-
149
-
150
-
151
-
152
-
153
-
154
-
155
-
156
-
157
-
158
-
159
-
160
-
161
-
162
-
163
-
164
-
165
-
166
-
167
-
168
-
169
-
170
-
171
-
172
-
173
-
174
-
175
-
176
-
177
-
178
-
179
-
180
-
181
-
182
-
183
-
184
-
185
-
186
-
187
-
188
-
189
-
190
-
191
-
192
-
193
-
194
-
195
-
196
 |
 |

45
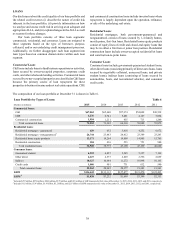
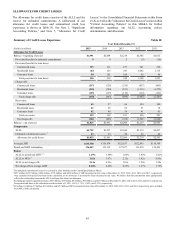
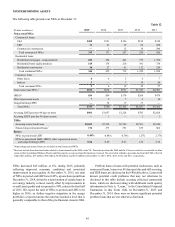
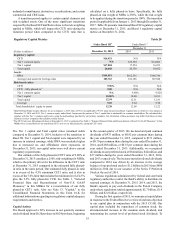
NONPERFORMING ASSETS
The following table presents our NPAs at December 31:
Table 12
(Dollars in millions) 2015 2014 2013 2012 2011
Nonaccrual/NPLs:
Commercial loans:
C&I $308 $151 $196 $194 $348
CRE 11 21 39 66 288
Commercial construction —1 12 34 290
Total commercial NPLs 319 173 247 294 926
Residential loans:
Residential mortgages - nonguaranteed 183 254 441 775 1,392
Residential home equity products 145 174 210 341 338
Residential construction 16 27 61 112 220
Total residential NPLs 344 455 712 1,228 1,950
Consumer loans:
Other direct 66567
Indirect 3— 7 19 20
Total consumer NPLs 96 12 25 27
Total nonaccrual/NPLs 1$672 $634 $971 $1,547 $2,903
OREO 2$56 $99 $170 $264 $479
Other repossessed assets 79 7 9 10
Nonperforming LHFS —38 17 37 —
Total NPAs $735 $780 $1,165 $1,857 $3,392
Accruing LHFI past due 90 days or more $981 $1,057 $1,228 $782 $2,028
Accruing LHFS past due 90 days or more —1 — 1 3
TDRs:
Accruing restructured loans $2,603 $2,592 $2,749 $2,501 $2,820
Nonaccruing restructured loans 1176 273 391 639 802
Ratios:
NPLs to period-end LHFI 0.49% 0.48% 0.76% 1.27% 2.37%
NPAs to period-end LHFI, OREO, other repossessed assets,
and nonperforming LHFS 0.54 0.59 0.91 1.52 2.76
1 Nonaccruing restructured loans are included in total nonaccrual/NPLs.
2 Does not include foreclosed real estate related to loans insured by the FHA or the VA. Proceeds due from the FHA and the VA are recorded as a receivable in other
assets in the Consolidated Balance Sheets until the property is conveyed and the funds are received. The receivable related to proceeds due from the FHA or the VA
totaled $52 million, $57 million, $88 million, $140 million, and $132 million at December 31, 2015, 2014, 2013, 2012, and 2011, respectively.
NPAs decreased $45 million, or 6%, during 2015, primarily
reflecting improved economic conditions and associated
improvement in asset quality. At December 31, 2015, our ratio
of NPLs to period-end LHFI was 0.49%, up one basis point from
December 31, 2014, driven by a deterioration of certain loans in
our energy industry vertical, mostly offset by improvements in
overall asset quality and our proactive NPL sales in the first half
of 2015. We expect the ratio of NPLs to period-end LHFI to be
higher in 2016, as further negative migration in the energy
portfolio is expected and as the ratio has reached a level that is
generally comparable to that of the pre-financial crisis in 2006.
Problem loans or loans with potential weaknesses, such as
nonaccrual loans, loans over 90 days past due and still accruing,
and TDR loans, are disclosed in the NPA table above. Loans with
known potential credit problems that may not otherwise be
disclosed in this table include accruing criticized commercial
loans, which are disclosed along with additional credit quality
information in Note 6, “Loans,” to the Consolidated Financial
Statements in this Form 10-K. At December 31, 2015 and
December 31, 2014, there were no known significant potential
problem loans that are not otherwise disclosed.