SunTrust 2015 Annual Report Download - page 100
Download and view the complete annual report
Please find page 100 of the 2015 SunTrust annual report below. You can navigate through the pages in the report by either clicking on the pages listed below, or by using the keyword search tool below to find specific information within the annual report.-
 1
1 -
2
-
3
-
4
-
5
-
6
-
7
-
8
-
9
-
10
-
11
-
12
-
13
-
14
-
15
-
16
-
17
-
18
-
19
-
20
-
21
-
22
-
23
-
24
-
25
-
26
-
27
-
28
-
29
-
30
-
31
-
32
-
33
-
34
-
35
-
36
-
37
-
38
-
39
-
40
-
41
-
42
-
43
-
44
-
45
-
46
-
47
-
48
-
49
-
50
-
51
-
52
-
53
-
54
-
55
-
56
-
57
-
58
-
59
-
60
-
61
-
62
-
63
-
64
-
65
-
66
-
67
-
68
-
69
-
70
-
71
-
72
-
73
-
74
-
75
-
76
-
77
-
78
-
79
-
80
-
81
-
82
-
83
-
84
-
85
-
86
-
87
-
88
-
89
-
 90
90 -
 91
91 -
 92
92 -
 93
93 -
 94
94 -
 95
95 -
 96
96 -
 97
97 -
 98
98 -
 99
99 -
 100
100 -
 101
101 -
 102
102 -
 103
103 -
 104
104 -
 105
105 -
 106
106 -
 107
107 -
 108
108 -
 109
109 -
 110
110 -
111
-
112
-
113
-
114
-
115
-
116
-
117
-
118
-
119
-
120
-
121
-
122
-
123
-
124
-
125
-
126
-
127
-
128
-
129
-
130
-
131
-
132
-
133
-
134
-
135
-
136
-
137
-
138
-
139
-
140
-
141
-
142
-
143
-
144
-
145
-
146
-
147
-
148
-
149
-
150
-
151
-
152
-
153
-
154
-
155
-
156
-
157
-
158
-
159
-
160
-
161
-
162
-
163
-
164
-
165
-
166
-
167
-
168
-
169
-
170
-
171
-
172
-
173
-
174
-
175
-
176
-
177
-
178
-
179
-
180
-
181
-
182
-
183
-
184
-
185
-
186
-
187
-
188
-
189
-
190
-
191
-
192
-
193
-
194
-
195
-
196
 |
 |
72
Total noninterest expense was $92 million, a decrease of $8
million, or 8%, compared to 2013. The decrease was primarily
due to a reduction in expenses due to the sale of RidgeWorth,
partially offset by higher severance costs, incentive
compensation related to business performance, debt issuance
costs, and operating losses driven by the reversal of a loss accrual
in 2013.
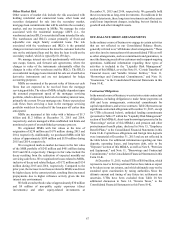
FOURTH QUARTER 2015 RESULTS
Quarter Ended December 31, 2015 vs. Quarter Ended
December 31, 2014
We reported net income available to common shareholders of
$467 million in the fourth quarter of 2015, an increase of $89
million compared with the same period of the prior year. Earnings
per average common diluted share were $0.91 for the fourth
quarter of 2015 and included a $0.03 per share discrete tax
benefit, compared to $0.72 for the fourth quarter of 2014, which
was negatively impacted by legacy mortgage legal matters
totaling $0.17 per share. Excluding the impacts of the discrete
matters in the current quarter and the fourth quarter of 2014,
earnings per share were relatively stable.
In the fourth quarter of 2015, net interest income (on an FTE
basis) was $1.3 billion, an increase of $33 million compared to
the fourth quarter of 2014. The increase was driven by growth
in average earning assets and a decrease in long-term debt,
partially offset by a slight decline in earning asset yields. Net
interest margin increased two basis points to 2.98% for the fourth
quarter of 2015, compared to the same period in 2014, due
primarily to a shift towards lower-cost funding sources.
The provision for credit losses was $51 million in the fourth
quarter of 2015, a decrease of $23 million, or 31%, compared to
the fourth quarter of 2014, driven by the overall improvement
in asset quality, in addition to lower net charge-offs.
Total noninterest income was $765 million for the fourth
quarter of 2015, a decrease of $30 million, or 4%, compared to
the fourth quarter of 2014. The decrease was attributed to lower
investment banking, wealth management, and mortgage-related
revenue as well as a decline in service charges on deposits.
Investment banking income decreased $5 million in the
fourth quarter of 2015, compared to the fourth quarter of 2014,
which was driven by a decline in debt origination activity
stemming from challenging market conditions, partially offset
by growth in equity originations. Trust and investment
management income decreased $5 million in the fourth quarter
of 2015, compared to the fourth quarter of 2014, largely due to
a decline in assets under management.
Mortgage production related income was $53 million in the
fourth quarter of 2015, a decrease of $8 million compared to the
fourth quarter of 2014, driven by a modest decline in gain-on-
sale margins. Mortgage servicing income increased $3 million
compared to the fourth quarter of 2014 due to higher servicing
fees as a result of a larger servicing portfolio, driven by portfolio
acquisitions.
Other noninterest income decreased $12 million in the
fourth quarter of 2015, compared to the fourth quarter of 2014,
due largely to foregone income from the sale of affordable
housing investments in 2015.
Total noninterest expense was $1.3 billion in the fourth
quarter of 2015, a decrease of $122 million compared to the
fourth quarter of 2014. The decrease compared to prior year was
due primarily to the $145 million legal provision related to legacy
mortgage matters, reflected in operating losses, in the fourth
quarter of 2014.
Employee compensation and benefits expense increased
$20 million in the fourth quarter of 2015, compared to the fourth
quarter of 2014, primarily due to higher employee compensation
expense, driven by improved business performance, and
partially offset by a decrease in employee benefit costs.
Outside processing and software expense was $222 million
in the current quarter, compared to $206 million in the fourth
quarter of 2014. The increase was due to higher utilization of
third-party services, increased business activity, and certain
discrete costs incurred in the current quarter.
Other noninterest expense decreased $19 million compared
to the fourth quarter of 2014, primarily driven by lower credit
and collections costs and lower consulting expenses.
The income tax provision for the fourth quarter of 2015 was
$185 million, compared to the fourth quarter of 2014 income tax
provision of $128 million. The effective tax rate for the fourth
quarter of 2015 was approximately 28%, compared to
approximately 25% in the fourth quarter of 2014. Excluding the
$57 million tax impact of the aforementioned $145 million legal
provision related to legacy mortgage matters, the fourth quarter
2014 tax provision was $185 million, and the effective tax rate
was approximately 28%.