SunTrust 2015 Annual Report Download - page 77
Download and view the complete annual report
Please find page 77 of the 2015 SunTrust annual report below. You can navigate through the pages in the report by either clicking on the pages listed below, or by using the keyword search tool below to find specific information within the annual report.-
 1
1 -
2
-
3
-
4
-
5
-
6
-
7
-
8
-
9
-
10
-
11
-
12
-
13
-
14
-
15
-
16
-
17
-
18
-
19
-
20
-
21
-
22
-
23
-
24
-
25
-
26
-
27
-
28
-
29
-
30
-
31
-
32
-
33
-
34
-
35
-
36
-
37
-
38
-
39
-
40
-
41
-
42
-
43
-
44
-
45
-
46
-
47
-
48
-
49
-
50
-
51
-
52
-
53
-
54
-
55
-
56
-
57
-
58
-
59
-
60
-
61
-
62
-
63
-
64
-
65
-
66
-
 67
67 -
 68
68 -
 69
69 -
 70
70 -
 71
71 -
 72
72 -
 73
73 -
 74
74 -
 75
75 -
 76
76 -
 77
77 -
 78
78 -
 79
79 -
 80
80 -
 81
81 -
 82
82 -
 83
83 -
 84
84 -
 85
85 -
 86
86 -
 87
87 -
88
-
89
-
90
-
91
-
92
-
93
-
94
-
95
-
96
-
97
-
98
-
99
-
100
-
101
-
102
-
103
-
104
-
105
-
106
-
107
-
108
-
109
-
110
-
111
-
112
-
113
-
114
-
115
-
116
-
117
-
118
-
119
-
120
-
121
-
122
-
123
-
124
-
125
-
126
-
127
-
128
-
129
-
130
-
131
-
132
-
133
-
134
-
135
-
136
-
137
-
138
-
139
-
140
-
141
-
142
-
143
-
144
-
145
-
146
-
147
-
148
-
149
-
150
-
151
-
152
-
153
-
154
-
155
-
156
-
157
-
158
-
159
-
160
-
161
-
162
-
163
-
164
-
165
-
166
-
167
-
168
-
169
-
170
-
171
-
172
-
173
-
174
-
175
-
176
-
177
-
178
-
179
-
180
-
181
-
182
-
183
-
184
-
185
-
186
-
187
-
188
-
189
-
190
-
191
-
192
-
193
-
194
-
195
-
196
 |
 |

49
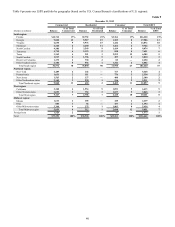
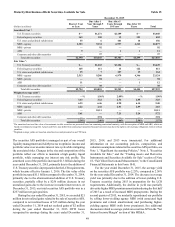
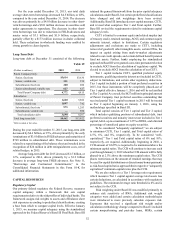
Maturity Distribution of Debt Securities Available for Sale Table 15
December 31, 2015
(Dollars in millions)
Due in 1 Year
or Less
Due After 1
Year through 5
Years
Due After 5
Years through
10 Years
Due After 10
Years Total
Amortized Cost 1:
U.S. Treasury securities $— $1,271 $2,189 $— $3,460
Federal agency securities 163 105 13 121 402
U.S. states and political subdivisions 35 6 101 14 156
MBS - agency 2,383 9,134 6,997 4,363 22,877
MBS - private — 92 — — 92
ABS 9 — 1 1 11
Corporate and other debt securities — 37 — — 37
Total debt securities $2,590 $10,645 $9,301 $4,499 $27,035
Fair Value 1:
U.S. Treasury securities $— $1,265 $2,184 $— $3,449
Federal agency securities 165 111 13 122 411
U.S. states and political subdivisions 35 7 107 15 164
MBS - agency 2,513 9,286 6,979 4,346 23,124
MBS - private — 94 — — 94
ABS 11 — — 1 12
Corporate and other debt securities — 38 — — 38
Total debt securities $2,724 $10,801 $9,283 $4,484 $27,292
Weighted average yield 2:
U.S. Treasury securities —% 1.56% 2.09% —% 1.90%
Federal agency securities 3.63 3.22 2.54 2.85 3.25
U.S. states and political subdivisions 6.35 6.46 4.90 6.14 5.40
MBS - agency 2.22 2.42 2.81 2.89 2.61
MBS - private — 10.11 — — 10.11
ABS 5.61 — 7.21 5.24 5.72
Corporate and other debt securities — 3.94 — — 3.94
Total debt securities 2.38% 2.40% 2.66% 2.90% 2.57%
1 The amortized cost and fair value of investments in debt securities are presented based on remaining contractual maturity, with the exception of MBS and ABS, which are
based on estimated average life. Actual cash flows may differ from contractual maturities because borrowers may have the right to call or prepay obligations with or without
penalties.
2 Weighted average yields are based on amortized cost and presented on an FTE basis.
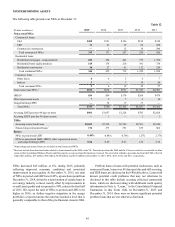
The securities AFS portfolio is managed as part of our overall
liquidity management and ALM process to optimize income and
portfolio value over an entire interest rate cycle while mitigating
the associated risks. Changes in the size and composition of the
portfolio reflect our efforts to maintain a high quality, liquid
portfolio, while managing our interest rate risk profile. The
amortized cost of the portfolio increased $1.3 billion during the
year ended December 31, 2015, primarily due to the addition of
U.S. Treasury securities in preparation for the LCR requirements,
which became effective January 1, 2016. The fair value of the
portfolio increased $1.1 billion compared to December 31, 2014,
primarily due to the aforementioned addition of U.S. Treasury
securities, partially offset by a $256 million decrease in net
unrealized gains due to the increase in market interest rates. At
December 31, 2015, our total securities AFS portfolio was in a
$257 million net gain position.
During the year ended December 31, 2015, we recorded $21
million in net realized gains related to the sale of securities AFS,
compared to net realized losses of $15 million during the year
ended December 31, 2014 and net realized gains of $2 million
during the year ended December 31, 2013. OTTI losses
recognized in earnings during the years ended December 31,
2015, 2014, and 2013 were immaterial. For additional
information on our accounting policies, composition, and
valuation assumptions related to the securities AFS portfolio, see
Note 1, "Significant Accounting Policies," Note 5, "Securities
Available for Sale," and the “Trading Assets and Derivative
Instruments and Securities Available for Sale” section of Note
18, “Fair Value Election and Measurement,” to the Consolidated
Financial Statements in this Form 10-K.
For the year ended December 31, 2015, the average yield
on the securities AFS portfolio was 2.25%, compared to 2.56%
for the year ended December 31, 2014. The decrease in average
yield was primarily due to the addition of lower-yielding U.S.
Treasury securities during 2015 in preparation for the LCR
requirements. Additionally, the decline in yield was partially
driven by higher MBS premium amortization during the first half
of 2015 as a result of increased MBS prepayments. During the
second quarter of 2015, we modestly repositioned our portfolio
by selling lower-yielding agency MBS (with associated high
premiums and related amortization) and purchasing higher-
yielding agency MBS (with lower premiums). See additional
discussion related to average yields on securities AFS in the "Net
Interest Income/Margin" section of this MD&A.