SunTrust 2015 Annual Report Download - page 70
Download and view the complete annual report
Please find page 70 of the 2015 SunTrust annual report below. You can navigate through the pages in the report by either clicking on the pages listed below, or by using the keyword search tool below to find specific information within the annual report.-
 1
1 -
2
-
3
-
4
-
5
-
6
-
7
-
8
-
9
-
10
-
11
-
12
-
13
-
14
-
15
-
16
-
17
-
18
-
19
-
20
-
21
-
22
-
23
-
24
-
25
-
26
-
27
-
28
-
29
-
30
-
31
-
32
-
33
-
34
-
35
-
36
-
37
-
38
-
39
-
40
-
41
-
42
-
43
-
44
-
45
-
46
-
47
-
48
-
49
-
50
-
51
-
52
-
53
-
54
-
55
-
56
-
57
-
58
-
59
-
 60
60 -
 61
61 -
 62
62 -
 63
63 -
 64
64 -
 65
65 -
 66
66 -
 67
67 -
 68
68 -
 69
69 -
 70
70 -
 71
71 -
 72
72 -
 73
73 -
 74
74 -
 75
75 -
 76
76 -
 77
77 -
 78
78 -
 79
79 -
 80
80 -
81
-
82
-
83
-
84
-
85
-
86
-
87
-
88
-
89
-
90
-
91
-
92
-
93
-
94
-
95
-
96
-
97
-
98
-
99
-
100
-
101
-
102
-
103
-
104
-
105
-
106
-
107
-
108
-
109
-
110
-
111
-
112
-
113
-
114
-
115
-
116
-
117
-
118
-
119
-
120
-
121
-
122
-
123
-
124
-
125
-
126
-
127
-
128
-
129
-
130
-
131
-
132
-
133
-
134
-
135
-
136
-
137
-
138
-
139
-
140
-
141
-
142
-
143
-
144
-
145
-
146
-
147
-
148
-
149
-
150
-
151
-
152
-
153
-
154
-
155
-
156
-
157
-
158
-
159
-
160
-
161
-
162
-
163
-
164
-
165
-
166
-
167
-
168
-
169
-
170
-
171
-
172
-
173
-
174
-
175
-
176
-
177
-
178
-
179
-
180
-
181
-
182
-
183
-
184
-
185
-
186
-
187
-
188
-
189
-
190
-
191
-
192
-
193
-
194
-
195
-
196
 |
 |
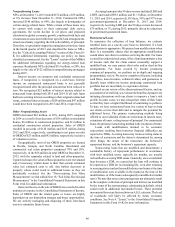
42
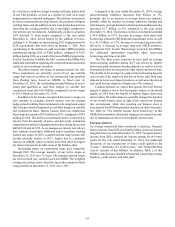
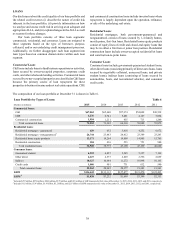
2014, and the average outstanding loan size was approximately
$46,000 at both December 31, 2015 and 2014.
Consumer loans increased $1.3 billion, or 6%, during 2015
compared to December 31, 2014. The increase was attributable
to a $1.6 billion, or 34%, increase in consumer direct loans given
continued growth in our online origination channels and
partnerships, and a $185 million, or 21%, increase in credit cards,
partially offset by a $517 million, or 5%, decrease in indirect
loans. The decrease in consumer indirect loans was due to our
securitization of $1.0 billion in consumer indirect auto loans
during 2015, partially offset by new originations. Going forward,
we may periodically conduct additional auto loan securitization
transactions, as they allow us to more efficiently use the balance
sheet and diversify our funding sources, while still being an
active loan originator and partner to our auto dealership clients.
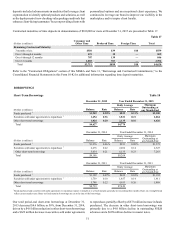
Loans Held for Sale
LHFS decreased $1.4 billion, or 43%, during 2015, largely due
to loan sales and transfers out of LHFS exceeding the flow of
mortgage production into LHFS. Loan transfers from LHFS to
LHFI totaled $741 million during 2015, comprised primarily of
indirect auto and C&I loans that were previously transferred to
LHFS during 2014 in anticipation of being sold, but no longer
met the criteria for sale.
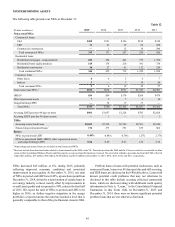
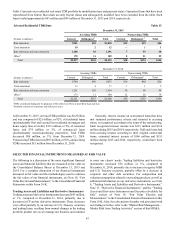
Asset Quality
Our asset quality remained favorable during 2015, driven by
improved residential housing markets, resolution of NPAs, and
lower levels of new NPLs in most loan classes except C&I, which
increased primarily due to deterioration in our energy-related
exposure. While our asset quality performance can be attributed,
in part, to the proactive actions we have taken over the past
several years to de-risk, diversify, and improve the quality of our
loan portfolio, we also recognize that our strong asset quality
will eventually normalize.
NPAs decreased $45 million, or 6%, compared to
December 31, 2014. At December 31, 2015, the percentage of
NPLs to total LHFI was 0.49%, an increase of one basis point
compared to December 31, 2014 due to the aforementioned
energy NPLs. Higher NPLs were offset by a decline in OREO
and nonperforming LHFS.
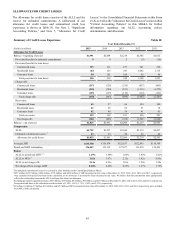
Net charge-offs were $341 million during 2015, compared
to $445 million during 2014, a decrease of $104 million, or 23%.
During 2015, the net charge-off ratio declined to 0.26%,
compared to 0.34% during 2014. For 2016, we expect NPLs and
net charge-offs to increase primarily as a result of further stress
amongst our energy clients, but also due to a normalization from
the low levels experienced in 2015. However, we expect our
overall net charge-off ratio to be between 30 and 40 basis points
in 2016, which is below our long-term expectation of 40 to 70
basis points.
Total early stage delinquencies increased six basis points
from December 31, 2014 to 0.70% of total loans at December 31,
2015. Early stage delinquencies, excluding government-
guaranteed loans, were 0.30% at both December 31, 2015 and
2014.
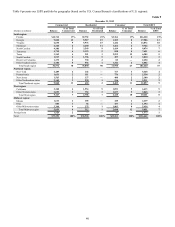
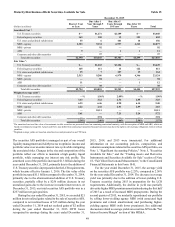
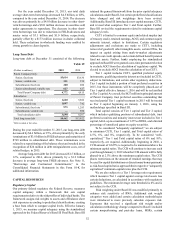
Energy-related Loan Exposure
We believe that our LHFI portfolio is well diversified by product,
client, and geography. However, the LHFI portfolio may be
exposed to concentrations of credit risk which exist in relation
to individual borrowers or groups of borrowers, types of
collateral, certain industries, certain loan products, or regions of
the country.
The energy industry vertical is a component of our CIB
business. Outstanding loans in the energy portfolio totaled $3.1
billion at December 31, 2015, and represented 2% of the total
loan portfolio. Total exposure, which includes funded and
unfunded commitments, was $9.3 billion at December 31, 2015,
and represented 4% of our total funded and unfunded
commitments. We anticipate our total exposure to remain
relatively stable; however, as energy clients evaluate their cash
flow needs it is possible that outstanding loans could increase as
clients draw against their unfunded commitments. Loans in the
energy portfolio that were in a second lien position were
immaterial.
Exposures to the two most adversely impacted sectors,
namely oil field services and exploration & production,
represented 15% and 23%, respectively, of our energy loan
portfolio at December 31, 2015. The remaining energy loan
portfolio relates to borrowers in the midstream (i.e., pipeline &
transportation) and downstream (i.e., refining & distribution)
energy sectors, which have not been as meaningfully impacted
by commodity price volatility.
At December 31, 2015, 6% of our total energy loans were
nonperforming and 19% were criticized (which includes
nonperforming loans and criticized accruing loans). At
December 31, 2015, 86% of our nonperforming energy loans
were current with respect to payments, however, they were
classified as nonperforming as discussed in the "Critical
Accounting Policies" section of this MD&A and in Note 1,
"Significant Accounting Policies," to the Consolidated Financial
Statements in this Form 10-K.
We believe that we have taken a vigilant approach to
managing our energy exposure and accounting for increased
probable loss content in our reserve estimation process. At
December 31, 2015, reserves associated with the energy
portfolio represented 4.6% of total outstanding energy loans. The
decline in oil prices during the first quarter of 2016 will likely
result in further asset quality deterioration of loans in the energy
industry vertical, which will increase NPLs and criticized
accruing loans, and potentially result in higher energy-related
reserves and net charge-offs. These trends and other relevant
inputs are incorporated into our total first quarter 2016 provision
for loan losses estimate of between $80 million and $110 million,
as discussed in the "Allowance for Credit Losses" section of this
MD&A. We believe that our energy-related risk is manageable,
especially in the context of the overall Company, and we will
continue to carefully monitor and manage our energy exposures.
See Note 6, “Loans,” to the Consolidated Financial Statements
in this Form 10-K for more information on our LHFI portfolio.