SunTrust 2015 Annual Report Download - page 69
Download and view the complete annual report
Please find page 69 of the 2015 SunTrust annual report below. You can navigate through the pages in the report by either clicking on the pages listed below, or by using the keyword search tool below to find specific information within the annual report.-
 1
1 -
2
-
3
-
4
-
5
-
6
-
7
-
8
-
9
-
10
-
11
-
12
-
13
-
14
-
15
-
16
-
17
-
18
-
19
-
20
-
21
-
22
-
23
-
24
-
25
-
26
-
27
-
28
-
29
-
30
-
31
-
32
-
33
-
34
-
35
-
36
-
37
-
38
-
39
-
40
-
41
-
42
-
43
-
44
-
45
-
46
-
47
-
48
-
49
-
50
-
51
-
52
-
53
-
54
-
55
-
56
-
57
-
58
-
 59
59 -
 60
60 -
 61
61 -
 62
62 -
 63
63 -
 64
64 -
 65
65 -
 66
66 -
 67
67 -
 68
68 -
 69
69 -
 70
70 -
 71
71 -
 72
72 -
 73
73 -
 74
74 -
 75
75 -
 76
76 -
 77
77 -
 78
78 -
 79
79 -
80
-
81
-
82
-
83
-
84
-
85
-
86
-
87
-
88
-
89
-
90
-
91
-
92
-
93
-
94
-
95
-
96
-
97
-
98
-
99
-
100
-
101
-
102
-
103
-
104
-
105
-
106
-
107
-
108
-
109
-
110
-
111
-
112
-
113
-
114
-
115
-
116
-
117
-
118
-
119
-
120
-
121
-
122
-
123
-
124
-
125
-
126
-
127
-
128
-
129
-
130
-
131
-
132
-
133
-
134
-
135
-
136
-
137
-
138
-
139
-
140
-
141
-
142
-
143
-
144
-
145
-
146
-
147
-
148
-
149
-
150
-
151
-
152
-
153
-
154
-
155
-
156
-
157
-
158
-
159
-
160
-
161
-
162
-
163
-
164
-
165
-
166
-
167
-
168
-
169
-
170
-
171
-
172
-
173
-
174
-
175
-
176
-
177
-
178
-
179
-
180
-
181
-
182
-
183
-
184
-
185
-
186
-
187
-
188
-
189
-
190
-
191
-
192
-
193
-
194
-
195
-
196
 |
 |

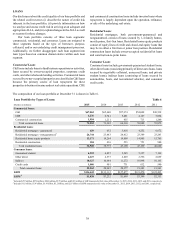
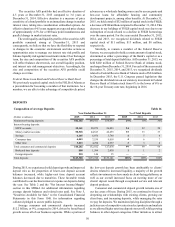
41
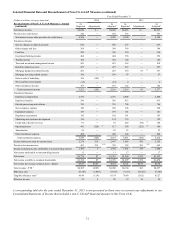
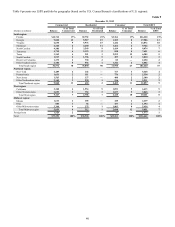
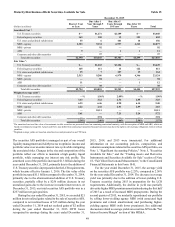
December 31, 2014
Commercial Residential Consumer Total LHFI
(Dollars in millions) Balance % of Total
Commercial Balance % of Total
Residential Balance % of Total
Consumer Balance % of Total
LHFI
South region:
Florida $12,333 17% $10,152 26% $3,651 17% $26,136 20%
Georgia 9,221 13 5,955 15 1,579 8 16,755 13
Virginia 7,191 10 5,721 15 1,479 7 14,391 11
Maryland 3,903 5 3,952 10 1,304 6 9,159 7
North Carolina 3,733 5 3,623 9 1,366 7 8,722 7
Tennessee 4,728 6 2,237 6 749 4 7,714 6
Texas 3,247 4 372 1 2,386 11 6,005 5
South Carolina 1,441 2 1,855 5 431 2 3,727 3
District of Columbia 1,313 2 703 2 92 — 2,108 2
Other Southern states 3,663 5 565 1 1,475 7 5,703 4
Total South region 50,773 69 35,135 91 14,512 69 100,420 75
Northeast region:
New York 4,291 6 145 — 677 3 5,113 4
Pennsylvania 1,675 2 117 — 691 3 2,483 2
New Jersey 1,528 2 141 — 361 2 2,030 2
Other Northeastern states 2,327 3 236 1 444 2 3,007 2
Total Northeast region 9,821 13 639 2 2,173 10 12,633 9
West region:
California 3,006 4 1,622 4 899 4 5,527 4
Other Western states 2,332 3 798 2 899 4 4,029 3
Total West region 5,338 7 2,420 6 1,798 9 9,556 7
Midwest region:
Illinois 2,180 3 233 1 352 2 2,765 2
Ohio 935 1 56 — 388 2 1,379 1
Other Midwestern states 3,054 4 292 1 1,686 8 5,032 4
Total Midwest region 6,169 8 581 1 2,426 12 9,176 7
Foreign loans 1,291 2 — — 36 — 1,327 1
Total $73,392 100% $38,775 100% $20,945 100% $133,112 100%
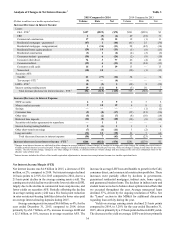
Loans Held for Investment
LHFI totaled $136.4 billion at December 31, 2015, an increase
of $3.3 billion, or 3%, from December 31, 2014, driven largely
by growth in C&I, consumer direct, and residential mortgage
loans, partially offset by a decrease in residential home equity
products, CRE, and indirect loans due to paydowns and
dispositions.
Average loans during 2015 totaled $133.6 billion, up $2.7
billion, or 2%, compared to 2014. Average performing loans
increased $3.0 billion, or 2%, driven primarily by growth in C&I
and consumer direct, which was partially offset by payoffs in
home equity, reductions in guaranteed mortgages and student
loans, and a decrease in consumer indirect loans due to a $1.0
billion auto loan securitization completed in June 2015. See the
"Net Interest Income/Margin" section of this MD&A for more
information regarding average loan balances.
Commercial loans increased $1.9 billion, or 3%, during
2015 compared to December 31, 2014. C&I loans increased $1.6
billion, or 2%, compared to December 31, 2014, driven by
growth in a number of industry verticals and client segments.
Commercial construction loans increased $743 million, or 61%,
compared to December 31, 2014, driven primarily by advances
on existing loans with developer clients. CRE loans decreased
$505 million, or 7%, compared to December 31, 2014, largely
due to elevated paydowns.
Residential loans were relatively stable during 2015
compared to December 31, 2014. Nonguaranteed residential
mortgages increased $1.3 billion, or 6%, offset by a $1.1 billion,
or 8%, decrease in residential home equity products. Residential
home equity products decreased as paydowns exceeded new
originations and draws during 2015.
At December 31, 2015, 40% of our residential home equity
products were in a first lien position and 60% were in a junior
lien position. For residential home equity products in a junior
lien position, we own or service 30% of the loans that are senior
to the home equity product. Additionally, approximately 13% of
the home equity line portfolio is due to convert to amortizing
term loans by the end of 2016 and an additional 30% enter the
conversion phase over the following three years. Based on
historical trends, within 12 months of the end of their draw
period, approximately 82% of all accounts, and approximately
72% of accounts with a balance, are closed or refinanced into an
amortizing loan or a new line of credit.
We perform credit management activities to limit our loss
exposure on home equity accounts. These activities may result
in the suspension of available credit and curtailment of available
draws of most home equity junior lien accounts when the first
lien position is delinquent, including when the junior lien is still
current. We monitor the delinquency status of first mortgages
serviced by other parties and actively monitor refreshed credit
bureau scores of borrowers with junior liens, as these scores are
highly sensitive to first lien mortgage delinquency. At December
31, 2015 and 2014, the loss severity on home equity junior lien
accounts was approximately 75% and 80%, respectively. The
average borrower FICO score related to loans in our home equity
portfolio was approximately 760 at both December 31, 2015 and