SunTrust 2015 Annual Report Download - page 103
Download and view the complete annual report
Please find page 103 of the 2015 SunTrust annual report below. You can navigate through the pages in the report by either clicking on the pages listed below, or by using the keyword search tool below to find specific information within the annual report.-
 1
1 -
2
-
3
-
4
-
5
-
6
-
7
-
8
-
9
-
10
-
11
-
12
-
13
-
14
-
15
-
16
-
17
-
18
-
19
-
20
-
21
-
22
-
23
-
24
-
25
-
26
-
27
-
28
-
29
-
30
-
31
-
32
-
33
-
34
-
35
-
36
-
37
-
38
-
39
-
40
-
41
-
42
-
43
-
44
-
45
-
46
-
47
-
48
-
49
-
50
-
51
-
52
-
53
-
54
-
55
-
56
-
57
-
58
-
59
-
60
-
61
-
62
-
63
-
64
-
65
-
66
-
67
-
68
-
69
-
70
-
71
-
72
-
73
-
74
-
75
-
76
-
77
-
78
-
79
-
80
-
81
-
82
-
83
-
84
-
85
-
86
-
87
-
88
-
89
-
90
-
91
-
92
-
 93
93 -
 94
94 -
 95
95 -
 96
96 -
 97
97 -
 98
98 -
 99
99 -
 100
100 -
 101
101 -
 102
102 -
 103
103 -
 104
104 -
 105
105 -
 106
106 -
 107
107 -
 108
108 -
 109
109 -
 110
110 -
 111
111 -
 112
112 -
 113
113 -
114
-
115
-
116
-
117
-
118
-
119
-
120
-
121
-
122
-
123
-
124
-
125
-
126
-
127
-
128
-
129
-
130
-
131
-
132
-
133
-
134
-
135
-
136
-
137
-
138
-
139
-
140
-
141
-
142
-
143
-
144
-
145
-
146
-
147
-
148
-
149
-
150
-
151
-
152
-
153
-
154
-
155
-
156
-
157
-
158
-
159
-
160
-
161
-
162
-
163
-
164
-
165
-
166
-
167
-
168
-
169
-
170
-
171
-
172
-
173
-
174
-
175
-
176
-
177
-
178
-
179
-
180
-
181
-
182
-
183
-
184
-
185
-
186
-
187
-
188
-
189
-
190
-
191
-
192
-
193
-
194
-
195
-
196
 |
 |

75
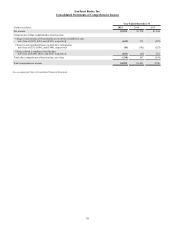
SunTrust Banks, Inc.
Consolidated Statements of Income
Year Ended December 31
(Dollars in millions and shares in thousands, except per share data) 2015 2014 2013
Interest Income
Interest and fees on loans $4,506 $4,617 $4,633
Interest and fees on loans held for sale 82 78 107
Interest and dividends on securities available for sale 593 613 579
Trading account interest and other 84 76 69
Total interest income 5,265 5,384 5,388
Interest Expense
Interest on deposits 219 235 291
Interest on long-term debt 252 270 210
Interest on other borrowings 30 39 34
Total interest expense 501 544 535
Net interest income 4,764 4,840 4,853
Provision for credit losses 165 342 553
Net interest income after provision for credit losses 4,599 4,498 4,300
Noninterest Income
Service charges on deposit accounts 622 645 657
Other charges and fees 377 368 369
Card fees 329 320 310
Investment banking income 461 404 356
Trading income 181 182 182
Trust and investment management income 334 423 518
Retail investment services 300 297 267
Mortgage production related income 270 201 314
Mortgage servicing related income 169 196 87
Gain on sale of subsidiary —105 —
Net securities gains/(losses) 21 (15) 2
Other noninterest income 204 197 152
Total noninterest income 3,268 3,323 3,214
Noninterest Expense
Employee compensation 2,576 2,576 2,488
Employee benefits 366 386 413
Outside processing and software 815 741 746
Net occupancy expense 341 340 348
Equipment expense 164 169 181
Marketing and customer development 151 134 135
Regulatory assessments 139 142 181
Credit and collection services 71 91 264
Operating losses 56 441 503
Amortization 40 25 23
Other noninterest expense 1441 498 549
Total noninterest expense 5,160 5,543 5,831
Income before provision for income taxes 2,707 2,278 1,683
Provision for income taxes 1764 493 322
Net income including income attributable to noncontrolling interest 1,943 1,785 1,361
Net income attributable to noncontrolling interest 10 11 17
Net income $1,933 $1,774 $1,344
Net income available to common shareholders $1,863 $1,722 $1,297
Net income per average common share:
Diluted $3.58 $3.23 $2.41
Basic 3.62 3.26 2.43
Dividends declared per common share 0.92 0.70 0.35
Average common shares - diluted 520,586 533,391 539,093
Average common shares - basic 514,844 527,500 534,283
1 Amortization expense related to qualified affordable housing investment costs is recognized in provision for income taxes for each of the periods presented as allowed by an
accounting standard adopted in 2014. Accordingly, $49 million of related amortization expense for the year ended December 31, 2013 was reclassified from other noninterest
expense to provision for income taxes.
See accompanying Notes to Consolidated Financial Statements.