SunTrust 2015 Annual Report Download - page 72
Download and view the complete annual report
Please find page 72 of the 2015 SunTrust annual report below. You can navigate through the pages in the report by either clicking on the pages listed below, or by using the keyword search tool below to find specific information within the annual report.-
 1
1 -
2
-
3
-
4
-
5
-
6
-
7
-
8
-
9
-
10
-
11
-
12
-
13
-
14
-
15
-
16
-
17
-
18
-
19
-
20
-
21
-
22
-
23
-
24
-
25
-
26
-
27
-
28
-
29
-
30
-
31
-
32
-
33
-
34
-
35
-
36
-
37
-
38
-
39
-
40
-
41
-
42
-
43
-
44
-
45
-
46
-
47
-
48
-
49
-
50
-
51
-
52
-
53
-
54
-
55
-
56
-
57
-
58
-
59
-
60
-
61
-
 62
62 -
 63
63 -
 64
64 -
 65
65 -
 66
66 -
 67
67 -
 68
68 -
 69
69 -
 70
70 -
 71
71 -
 72
72 -
 73
73 -
 74
74 -
 75
75 -
 76
76 -
 77
77 -
 78
78 -
 79
79 -
 80
80 -
 81
81 -
 82
82 -
83
-
84
-
85
-
86
-
87
-
88
-
89
-
90
-
91
-
92
-
93
-
94
-
95
-
96
-
97
-
98
-
99
-
100
-
101
-
102
-
103
-
104
-
105
-
106
-
107
-
108
-
109
-
110
-
111
-
112
-
113
-
114
-
115
-
116
-
117
-
118
-
119
-
120
-
121
-
122
-
123
-
124
-
125
-
126
-
127
-
128
-
129
-
130
-
131
-
132
-
133
-
134
-
135
-
136
-
137
-
138
-
139
-
140
-
141
-
142
-
143
-
144
-
145
-
146
-
147
-
148
-
149
-
150
-
151
-
152
-
153
-
154
-
155
-
156
-
157
-
158
-
159
-
160
-
161
-
162
-
163
-
164
-
165
-
166
-
167
-
168
-
169
-
170
-
171
-
172
-
173
-
174
-
175
-
176
-
177
-
178
-
179
-
180
-
181
-
182
-
183
-
184
-
185
-
186
-
187
-
188
-
189
-
190
-
191
-
192
-
193
-
194
-
195
-
196
 |
 |

44
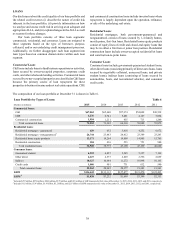
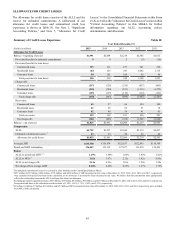
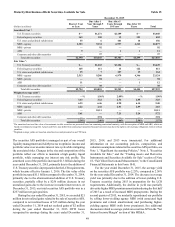
Provision for Credit Losses
The total provision for credit losses includes the provision/
(benefit) for loan losses and the provision/(benefit) for unfunded
commitments. The provision for loan losses is the result of a
detailed analysis performed to estimate an appropriate and
adequate ALLL. During 2015, the total provision for loan losses
decreased $182 million, or 54%, compared to 2014. This decline
in the overall provision for loan losses was driven primarily by
the further improvement in asset quality and lower net charge-
offs in our residential loan portfolio. Partially offsetting this
decline was an increase in our commercial loan loss provision,
primarily reflecting risk rating downgrades of certain energy
clients during 2015. The provision for unfunded commitments
increased during 2015 in response to the downgrade of a specific
unfunded exposure that was individually evaluated for loss
content, and an overall increase in the level of binding unused
commitments.
For the first quarter of 2016, we expect the provision for
loan losses to be between $80 million and $110 million, which
is higher than the fourth quarter of 2015, given the abatement of
asset quality improvements and continued loan growth.
However, the ultimate level of reserves and provision will be
determined by our rigorous, quarterly review processes, which
are informed by trends in our LHFI portfolio (including historical
loss experience, expected loss calculations, delinquencies,
performing status, size and composition of the loan portfolio,
and concentrations within the portfolio) combined with a view
on economic conditions. In addition to internal credit quality
metrics, the ALLL estimate is impacted by other indicators of
credit risk associated with the portfolio, such as geopolitical and
economic risks, and the increasing availability of credit and
resultant higher levels of leverage for consumers and commercial
borrowers.
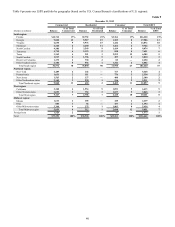
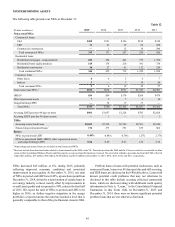
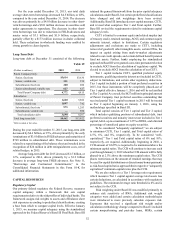
Allowance for Loan and Lease Losses
ALLL by Loan Segment Table 11
At December 31
(Dollars in millions) 2015 2014 2013 2012 2011
ALLL:
Commercial loans $1,047 $986 $946 $902 $964
Residential loans 534 777 930 1,131 1,354
Consumer loans 171 174 168 141 139
Total $1,752 $1,937 $2,044 $2,174 $2,457
Segment ALLL as a % of total ALLL:
Commercial loans 60% 51% 46% 41% 39%
Residential loans 30 40 46 52 55
Consumer loans 10 9876
Total 100% 100% 100% 100% 100%
Segment LHFI as a % of total LHFI:
Commercial loans 55% 55% 50% 48% 46%
Residential loans 29 29 34 36 38
Consumer loans 16 16 16 16 16
Total 100% 100% 100% 100% 100%
The ALLL decreased $185 million, or 10%, from December 31,
2014, to $1.8 billion at December 31, 2015. The decrease reflects
further improvement in asset quality experienced in 2015. The
ALLL to period-end LHFI ratio decreased 17 basis points from
December 31, 2014, to 1.29% at December 31, 2015, excluding
loans measured at fair value from period-end LHFI in the
calculation. Trends in the ALLL to period-end LHFI ratio will
depend on economic and asset quality conditions (as discussed
above), however, we would expect the ratio to remain generally
stable in 2016. The ratio of the ALLL to total NPLs decreased
to 2.62x at December 31, 2015, compared to 3.07x at
December 31, 2014, resulting from an increase in NPLs due
largely to the increase in specific energy-related NPLs during
2015 and the decrease in ALLL.