SunTrust 2015 Annual Report Download - page 119
Download and view the complete annual report
Please find page 119 of the 2015 SunTrust annual report below. You can navigate through the pages in the report by either clicking on the pages listed below, or by using the keyword search tool below to find specific information within the annual report.-
 1
1 -
2
-
3
-
4
-
5
-
6
-
7
-
8
-
9
-
10
-
11
-
12
-
13
-
14
-
15
-
16
-
17
-
18
-
19
-
20
-
21
-
22
-
23
-
24
-
25
-
26
-
27
-
28
-
29
-
30
-
31
-
32
-
33
-
34
-
35
-
36
-
37
-
38
-
39
-
40
-
41
-
42
-
43
-
44
-
45
-
46
-
47
-
48
-
49
-
50
-
51
-
52
-
53
-
54
-
55
-
56
-
57
-
58
-
59
-
60
-
61
-
62
-
63
-
64
-
65
-
66
-
67
-
68
-
69
-
70
-
71
-
72
-
73
-
74
-
75
-
76
-
77
-
78
-
79
-
80
-
81
-
82
-
83
-
84
-
85
-
86
-
87
-
88
-
89
-
90
-
91
-
92
-
93
-
94
-
95
-
96
-
97
-
98
-
99
-
100
-
101
-
102
-
103
-
104
-
105
-
106
-
107
-
108
-
 109
109 -
 110
110 -
 111
111 -
 112
112 -
 113
113 -
 114
114 -
 115
115 -
 116
116 -
 117
117 -
 118
118 -
 119
119 -
 120
120 -
 121
121 -
 122
122 -
 123
123 -
 124
124 -
 125
125 -
 126
126 -
 127
127 -
 128
128 -
 129
129 -
130
-
131
-
132
-
133
-
134
-
135
-
136
-
137
-
138
-
139
-
140
-
141
-
142
-
143
-
144
-
145
-
146
-
147
-
148
-
149
-
150
-
151
-
152
-
153
-
154
-
155
-
156
-
157
-
158
-
159
-
160
-
161
-
162
-
163
-
164
-
165
-
166
-
167
-
168
-
169
-
170
-
171
-
172
-
173
-
174
-
175
-
176
-
177
-
178
-
179
-
180
-
181
-
182
-
183
-
184
-
185
-
186
-
187
-
188
-
189
-
190
-
191
-
192
-
193
-
194
-
195
-
196
 |
 |

Notes to Consolidated Financial Statements, continued
91
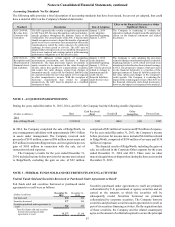
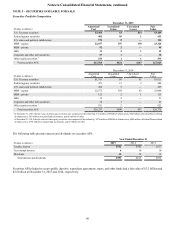
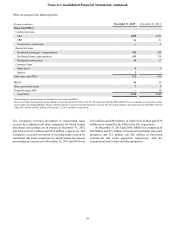
The following table presents the amortized cost, fair value, and weighted average yield of investments in debt securities AFS at
December 31, 2015, by remaining contractual maturity, with the exception of MBS and ABS, which are based on estimated average
life. Receipt of cash flows may differ from contractual maturities because borrowers may have the right to call or prepay obligations
with or without penalties.
Distribution of Remaining Maturities
(Dollars in millions)
Due in 1 Year
or Less
Due After 1
Year through 5
Years
Due After 5
Years through
10 Years
Due After 10
Years Total
Amortized Cost:
U.S. Treasury securities $— $1,271 $2,189 $— $3,460
Federal agency securities 163 105 13 121 402
U.S. states and political subdivisions 35 6 101 14 156
MBS - agency 2,383 9,134 6,997 4,363 22,877
MBS - private —92——92
ABS 9 — 1 1 11
Corporate and other debt securities —37——37
Total debt securities AFS $2,590 $10,645 $9,301 $4,499 $27,035
Fair Value:
U.S. Treasury securities $— $1,265 $2,184 $— $3,449
Federal agency securities 165 111 13 122 411
U.S. states and political subdivisions 35 7 107 15 164
MBS - agency 2,513 9,286 6,979 4,346 23,124
MBS - private —94——94
ABS 11 — — 1 12
Corporate and other debt securities —38——38
Total debt securities AFS $2,724 $10,801 $9,283 $4,484 $27,292
Weighted average yield 12.38% 2.40% 2.66% 2.90% 2.57%
1 Weighted average yields are based on amortized cost and are presented on an FTE basis.
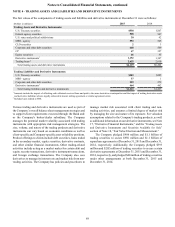
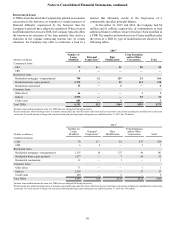
Securities AFS in an Unrealized Loss Position
The Company held certain investment securities AFS where
amortized cost exceeded fair value, resulting in unrealized loss
positions. Market changes in interest rates and credit spreads
may result in temporary unrealized losses as the market prices
of securities fluctuate. At December 31, 2015, the Company did
not intend to sell these securities nor was it more-likely-than-not
that the Company would be required to sell these securities before
their anticipated recovery or maturity. The Company reviewed
its portfolio for OTTI in accordance with the accounting policies
described in Note 1, "Significant Accounting Policies."
Securities AFS in an unrealized loss position at period end are presented in the following tables.
December 31, 2015
Less than twelve months Twelve months or longer Total
(Dollars in millions)
Fair
Value
Unrealized
Losses 2Fair
Value
Unrealized
Losses
Fair
Value
Unrealized
Losses 2
Temporarily impaired securities AFS:
U.S. Treasury securities $2,169 $14 $— $— $2,169 $14
Federal agency securities 75 — 34 1 109 1
MBS - agency 11,434 114 958 36 12,392 150
ABS — — 7 1 7 1
Other equity securities 3 1 — — 3 1
Total temporarily impaired securities AFS 13,681 129 999 38 14,680 167
OTTI securities AFS 1:
ABS 1 — — — 1 —
Total OTTI securities AFS 1 — — — 1 —
Total impaired securities AFS $13,682 $129 $999 $38 $14,681 $167