Sallie Mae 2011 Annual Report Download - page 98
Download and view the complete annual report
Please find page 98 of the 2011 Sallie Mae annual report below. You can navigate through the pages in the report by either clicking on the pages listed below, or by using the keyword search tool below to find specific information within the annual report.-
 1
1 -
2
-
3
-
4
-
5
-
6
-
7
-
8
-
9
-
10
-
11
-
12
-
13
-
14
-
15
-
16
-
17
-
18
-
19
-
20
-
21
-
22
-
23
-
24
-
25
-
26
-
27
-
28
-
29
-
30
-
31
-
32
-
33
-
34
-
35
-
36
-
37
-
38
-
39
-
40
-
41
-
42
-
43
-
44
-
45
-
46
-
47
-
48
-
49
-
50
-
51
-
52
-
53
-
54
-
55
-
56
-
57
-
58
-
59
-
60
-
61
-
62
-
63
-
64
-
65
-
66
-
67
-
68
-
69
-
70
-
71
-
72
-
73
-
74
-
75
-
76
-
77
-
78
-
79
-
80
-
81
-
82
-
83
-
84
-
85
-
86
-
87
-
 88
88 -
 89
89 -
 90
90 -
 91
91 -
 92
92 -
 93
93 -
 94
94 -
 95
95 -
 96
96 -
 97
97 -
 98
98 -
 99
99 -
 100
100 -
 101
101 -
 102
102 -
 103
103 -
 104
104 -
 105
105 -
 106
106 -
 107
107 -
 108
108 -
109
-
110
-
111
-
112
-
113
-
114
-
115
-
116
-
117
-
118
-
119
-
120
-
121
-
122
-
123
-
124
-
125
-
126
-
127
-
128
-
129
-
130
-
131
-
132
-
133
-
134
-
135
-
136
-
137
-
138
-
139
-
140
-
141
-
142
-
143
-
144
-
145
-
146
-
147
-
148
-
149
-
150
-
151
-
152
-
153
-
154
-
155
-
156
-
157
-
158
-
159
-
160
-
161
-
162
-
163
-
164
-
165
-
166
-
167
-
168
-
169
-
170
-
171
-
172
-
173
-
174
-
175
-
176
-
177
-
178
-
179
-
180
-
181
-
182
-
183
-
184
-
185
-
186
-
187
-
188
-
189
-
190
-
191
-
192
-
193
-
194
-
195
-
196
-
197
-
198
-
199
-
200
-
201
-
202
-
203
-
204
-
205
-
206
-
207
-
208
-
209
-
210
-
211
 |
 |

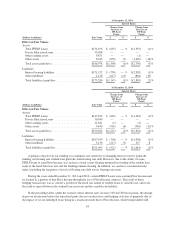
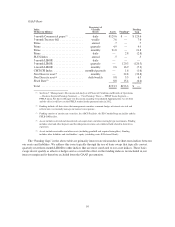
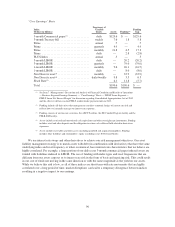
“Core Earnings” Basis
Index
(Dollars in billions)
Frequency of
Variable
Resets Assets Funding(2)
Funding
Gap
3-month Commercial paper(1) .............. daily $129.6 $ — $129.6
3-month Treasury bill .................... weekly 7.6 1.8 5.8
Prime ................................. annual .7 — .7
Prime ................................. quarterly 4.9 — 4.9
Prime ................................. monthly 21.8 4.5 17.3
Prime ................................. daily — 2.8 (2.8)
PLUS Index ............................ annual .5 — .5
3-month LIBOR ......................... daily — 20.2 (20.2)
3-month LIBOR ......................... quarterly — 79.0 (79.0)
1-month LIBOR ......................... monthly 9.6 26.1 (16.5)
1-month LIBOR ......................... daily — 8.0 (8.0)
Non Discrete reset(3) ...................... monthly — 32.9 (32.9)
Non Discrete reset(4) ...................... daily/weekly 9.8 3.5 6.3
Fixed Rate(5) ............................ 6.1 11.8 (5.7)
Total .................................. $190.6 $190.6 $ —
(1) See Item 7 “Management’s Discussion and Analysis of Financial Condition and Results of Operations
— Business Segment Earnings Summary — “Core Earnings” Basis — FFELP Loans Segment —
FFELP Loans Net Interest Margin” for discussion regarding Consolidated Appropriations Act of 2012
and the effect it will have on the FFELP student lender payment index in 2012.
(2) Funding includes all derivatives that management considers economic hedges of interest rate risk and
reflects how we internally manage our interest rate exposure.
(3) Funding consists of auction rate securities, the ABCP Facilities, the ED Conduit Program facility and the
FHLB-DM facility.
(4) Assets include restricted and unrestricted cash equivalents and other overnight type instruments. Funding
includes retail and other deposits and the obligation to return cash collateral held related to derivatives
exposures.
(5) Assets include receivables and other assets (including goodwill and acquired intangibles). Funding
includes other liabilities and stockholders’ equity (excluding series B Preferred Stock).
We use interest rate swaps and other derivatives to achieve our risk management objectives. Our asset
liability management strategy is to match assets with debt (in combination with derivatives) that have the same
underlying index and reset frequency or when economical, have interest rate characteristics that we believe are
highly correlated. For example, a large portion of our daily reset 3-month commercial paper indexed assets are
funded with liabilities indexed to LIBOR. The use of funding with index types and reset frequencies that are
different from our assets exposes us to interest rate risk in the form of basis and repricing risk. This could result
in our cost of funds not moving in the same direction or with the same magnitude as the yield on our assets.
While we believe this risk is low, as all of these indices are short-term with rate movements that are highly
correlated over a long period of time, market disruptions can lead to a temporary divergence between indices
resulting in a negative impact to our earnings.
96