Sallie Mae 2011 Annual Report Download - page 78
Download and view the complete annual report
Please find page 78 of the 2011 Sallie Mae annual report below. You can navigate through the pages in the report by either clicking on the pages listed below, or by using the keyword search tool below to find specific information within the annual report.-
 1
1 -
2
-
3
-
4
-
5
-
6
-
7
-
8
-
9
-
10
-
11
-
12
-
13
-
14
-
15
-
16
-
17
-
18
-
19
-
20
-
21
-
22
-
23
-
24
-
25
-
26
-
27
-
28
-
29
-
30
-
31
-
32
-
33
-
34
-
35
-
36
-
37
-
38
-
39
-
40
-
41
-
42
-
43
-
44
-
45
-
46
-
47
-
48
-
49
-
50
-
51
-
52
-
53
-
54
-
55
-
56
-
57
-
58
-
59
-
60
-
61
-
62
-
63
-
64
-
65
-
66
-
67
-
 68
68 -
 69
69 -
 70
70 -
 71
71 -
 72
72 -
 73
73 -
 74
74 -
 75
75 -
 76
76 -
 77
77 -
 78
78 -
 79
79 -
 80
80 -
 81
81 -
 82
82 -
 83
83 -
 84
84 -
 85
85 -
 86
86 -
 87
87 -
 88
88 -
89
-
90
-
91
-
92
-
93
-
94
-
95
-
96
-
97
-
98
-
99
-
100
-
101
-
102
-
103
-
104
-
105
-
106
-
107
-
108
-
109
-
110
-
111
-
112
-
113
-
114
-
115
-
116
-
117
-
118
-
119
-
120
-
121
-
122
-
123
-
124
-
125
-
126
-
127
-
128
-
129
-
130
-
131
-
132
-
133
-
134
-
135
-
136
-
137
-
138
-
139
-
140
-
141
-
142
-
143
-
144
-
145
-
146
-
147
-
148
-
149
-
150
-
151
-
152
-
153
-
154
-
155
-
156
-
157
-
158
-
159
-
160
-
161
-
162
-
163
-
164
-
165
-
166
-
167
-
168
-
169
-
170
-
171
-
172
-
173
-
174
-
175
-
176
-
177
-
178
-
179
-
180
-
181
-
182
-
183
-
184
-
185
-
186
-
187
-
188
-
189
-
190
-
191
-
192
-
193
-
194
-
195
-
196
-
197
-
198
-
199
-
200
-
201
-
202
-
203
-
204
-
205
-
206
-
207
-
208
-
209
-
210
-
211
 |
 |

this facility can be put to ED at the conclusion of the program thus eliminating a call on our liquidity, we intend
to refinance these assets in the term ABS market prior to the facility’s expiration. In addition, capacity is
maintained in our FFELP ABCP Facility and our FHLB-DM Facility to finance a portion of this collateral should
term financing not be achieved or available.
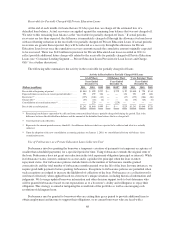
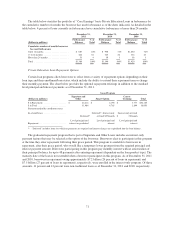
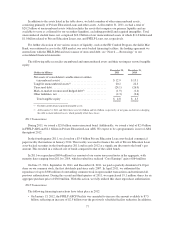
Sources of Liquidity and Available Capacity
The following tables detail our main sources of primary liquidity and our main sources of secondary
liquidity (unused secured credit facilities contingent upon obtaining eligible collateral).
(Dollars in millions) December 31, 2011 December 31, 2010
Sources of primary liquidity:
Unrestricted cash and liquid investments:
Cash and cash equivalents .................. $ 2,794 $ 4,342
Investments ............................. 71 85
Total unrestricted cash and liquid investments(1) . . $ 2,865 $ 4,427
Unencumbered FFELP Loans ................. $ 994 $ 1,441
Sources of secondary liquidity contingent on
obtaining eligible collateral:
Unused secured credit facilities: FFELP ABCP
Facilities and FHLB-DM Facility(2) ............ $11,312 $12,601
(1) At December 31, 2011 and 2010, ending balances include $1.5 billion and $2.0 billion, respectively, of cash and liquid
investments at the Bank. This cash will be used primarily to originate or acquire student loans at the Bank. Our ability to pay
dividends from the Bank is subject to capital and liquidity requirements applicable to the Bank.
(2) Current borrowing capacity under the FFELP ABCP Facilities and FHLB-DM Facility is determined based on qualifying
collateral from the unencumbered FFELP Loans reported in primary liquidity above. Additional borrowing capacity would
primarily be used to fund FFELP Loan portfolio acquisitions and to refinance FFELP Loans used as collateral in the ED
Conduit Program Facility. The total amount we can borrow is contingent upon obtaining eligible collateral. If we use our
unencumbered FFELP Loans as collateral to borrow against these facilities, the remaining amount we could borrow is
reduced accordingly.
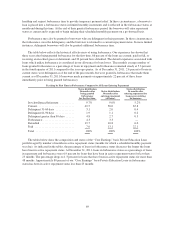
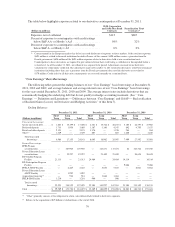
Average Balances
Years Ended December 31,
(Dollars in millions) 2011 2010 2009
Sources of primary liquidity:
Unrestricted cash and liquid investments:
Cash and cash equivalents .............................. $ 3,623 $ 6,078 $5,713
Investments .......................................... 95 94 145
Total unrestricted cash and liquid investments(1) ............... $ 3,718 $ 6,172 $5,858
Unused bank lines of credit ............................... $ — $ 2,069 $4,014
Unencumbered FFELP Loans ............................. $ 1,399 $ 1,897 $3,507
Sources of secondary liquidity contingent on obtaining eligible
collateral:
Unused secured credit facilities: FFELP ABCP Facilities and
FHLB-DM Facility(2) .................................. $11,356 $12,947 $1,802
(1) For the years ended December 31, 2011, 2010 and 2009, average balances include $1.2 billion, $2.3 billion and $2.0 billion,
respectively, of cash and liquid investments at the Bank. This cash will be used primarily to originate or acquire student loans at the
Bank. Our ability to pay dividends from the Bank is subject to capital and liquidity requirements applicable to the Bank.
(2) Current borrowing capacity under the FFELP ABCP Facilities and FHLB-DM Facility is determined based on qualifying collateral
from the unencumbered FFELP Loans reported in primary liquidity above. Additional borrowing capacity would primarily be used
to fund FFELP Loan portfolio acquisitions and to refinance FFELP Loans used as collateral in the ED Conduit Program Facility.
The total amount we can borrow is contingent upon obtaining eligible collateral. If we use our unencumbered FFELP Loans as
collateral to borrow against these facilities, the remaining amount we could borrow is reduced accordingly.
76