Sallie Mae 2011 Annual Report Download - page 35
Download and view the complete annual report
Please find page 35 of the 2011 Sallie Mae annual report below. You can navigate through the pages in the report by either clicking on the pages listed below, or by using the keyword search tool below to find specific information within the annual report.-
 1
1 -
2
-
3
-
4
-
5
-
6
-
7
-
8
-
9
-
10
-
11
-
12
-
13
-
14
-
15
-
16
-
17
-
18
-
19
-
20
-
21
-
22
-
23
-
24
-
 25
25 -
 26
26 -
 27
27 -
 28
28 -
 29
29 -
 30
30 -
 31
31 -
 32
32 -
 33
33 -
 34
34 -
 35
35 -
 36
36 -
 37
37 -
 38
38 -
 39
39 -
 40
40 -
 41
41 -
 42
42 -
 43
43 -
 44
44 -
 45
45 -
46
-
47
-
48
-
49
-
50
-
51
-
52
-
53
-
54
-
55
-
56
-
57
-
58
-
59
-
60
-
61
-
62
-
63
-
64
-
65
-
66
-
67
-
68
-
69
-
70
-
71
-
72
-
73
-
74
-
75
-
76
-
77
-
78
-
79
-
80
-
81
-
82
-
83
-
84
-
85
-
86
-
87
-
88
-
89
-
90
-
91
-
92
-
93
-
94
-
95
-
96
-
97
-
98
-
99
-
100
-
101
-
102
-
103
-
104
-
105
-
106
-
107
-
108
-
109
-
110
-
111
-
112
-
113
-
114
-
115
-
116
-
117
-
118
-
119
-
120
-
121
-
122
-
123
-
124
-
125
-
126
-
127
-
128
-
129
-
130
-
131
-
132
-
133
-
134
-
135
-
136
-
137
-
138
-
139
-
140
-
141
-
142
-
143
-
144
-
145
-
146
-
147
-
148
-
149
-
150
-
151
-
152
-
153
-
154
-
155
-
156
-
157
-
158
-
159
-
160
-
161
-
162
-
163
-
164
-
165
-
166
-
167
-
168
-
169
-
170
-
171
-
172
-
173
-
174
-
175
-
176
-
177
-
178
-
179
-
180
-
181
-
182
-
183
-
184
-
185
-
186
-
187
-
188
-
189
-
190
-
191
-
192
-
193
-
194
-
195
-
196
-
197
-
198
-
199
-
200
-
201
-
202
-
203
-
204
-
205
-
206
-
207
-
208
-
209
-
210
-
211
 |
 |

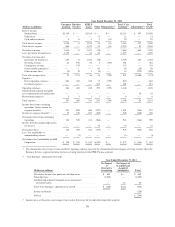
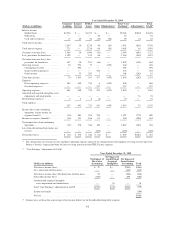
GAAP Statements of Income
Increase (Decrease)
Years Ended December 31, 2011 vs. 2010 2010 vs. 2009
(Dollars in millions, except per share amounts) 2011 2010 2009 $ % $ %
Interest income
FFELP Loans .................................... $3,461 $3,345 $3,094 $ 116 3% $ 251 8%
Private Education Loans ........................... 2,429 2,353 1,582 76 3 771 49
Other loans ...................................... 21 30 56 (9) (30) (26) (46)
Cash and investments .............................. 19 26 26 (7) (27) — —
Total interest income ................................ 5,930 5,754 4,758 176 3 996 21
Total interest expense ............................... 2,401 2,275 3,035 126 6 (760) (25)
Net interest income ................................. 3,529 3,479 1,723 50 1 1,756 102
Less: provisions for loan losses ........................ 1,295 1,419 1,119 (124) (9) 300 27
Net interest income after provisions for loan losses 2,234 2,060 604 174 8 1,456 241
Other income (loss):
Securitization servicing and Residual Interest revenue .... — — 295 — — (295) (100)
Gains (losses) on loans and investments, net ............ (35) 325 284 (360) (111) 41 14
Losses on derivative and hedging activities, net ......... (959) (361) (604) (598) 166 243 (40)
Servicing revenue ................................ 381 405 440 (24) (6) (35) (8)
Contingency revenue .............................. 333 330 294 3 1 36 12
Gains on debt repurchases .......................... 38 317 536 (279) (88) (219) (41)
Other income .................................... 68 6 88 62 1,033 (82) (93)
Total other income (loss) ............................. (174) 1,022 1,333 (1,196) (117) (311) (23)
Expenses:
Operating expenses ............................... 1,100 1,208 1,043 (108) (9) 165 16
Goodwill and acquired intangible assets impairment and
amortization expense ............................ 24 699 76 (675) (97) 623 820
Restructuring expenses ............................ 9 85 10 (76) (89) 75 750
Total expenses ..................................... 1,133 1,992 1,129 (859) (43) 863 76
Income from continuing operations, before income tax
expense ......................................... 927 1,090 808 (163) (15) 282 35
Income tax expense ................................. 328 493 264 (165) (33) 229 87
Net income from continuing operations ................. 599 597 544 2 — 53 10
Income (loss) from discontinued operations, net of tax ...... 33 (67) (220) 100 149 153 (70)
Net income ........................................ 632 530 324 102 19 206 64
Less: net loss attributable to noncontrolling interest ........ (1) — — (1) (100) — —
Net income attributable to SLM Corporation ............. 633 530 324 103 19 206 64
Preferred stock dividends ............................. 18 72 146 (54) (75) (74) (51)
Net income attributable to SLM Corporation common
stock ........................................... $ 615 $ 458 $ 178 $ 157 34%$ 280 157%
Basic earnings (loss) per common share attributable to
SLM Corporation:
Continuing operations ............................. $ 1.13 $ 1.08 $ .85 $ .05 5% $ .23 27%
Discontinued operations ........................... .06 (.14) (.47) .20 143 .33 (70)
Total ............................................. $ 1.19 $ .94 $ .38 $ .25 27% $ .56 147%
Diluted earnings (loss) per common share attributable to
SLM Corporation: ...............................
Continuing operations ............................. $ 1.12 $ 1.08 $ .85 $ .04 4% $ .23 27%
Discontinued operations ........................... .06 (.14) (.47) .20 143 .33 (70)
Total ............................................. $ 1.18 $ .94 $ .38 $ .24 26% $ .56 147%
Dividends per common share ......................... $ .30 $ — $ — $ .30 100% $ — — %
33