Sallie Mae 2011 Annual Report Download - page 112
Download and view the complete annual report
Please find page 112 of the 2011 Sallie Mae annual report below. You can navigate through the pages in the report by either clicking on the pages listed below, or by using the keyword search tool below to find specific information within the annual report.-
 1
1 -
2
-
3
-
4
-
5
-
6
-
7
-
8
-
9
-
10
-
11
-
12
-
13
-
14
-
15
-
16
-
17
-
18
-
19
-
20
-
21
-
22
-
23
-
24
-
25
-
26
-
27
-
28
-
29
-
30
-
31
-
32
-
33
-
34
-
35
-
36
-
37
-
38
-
39
-
40
-
41
-
42
-
43
-
44
-
45
-
46
-
47
-
48
-
49
-
50
-
51
-
52
-
53
-
54
-
55
-
56
-
57
-
58
-
59
-
60
-
61
-
62
-
63
-
64
-
65
-
66
-
67
-
68
-
69
-
70
-
71
-
72
-
73
-
74
-
75
-
76
-
77
-
78
-
79
-
80
-
81
-
82
-
83
-
84
-
85
-
86
-
87
-
88
-
89
-
90
-
91
-
92
-
93
-
94
-
95
-
96
-
97
-
98
-
99
-
100
-
101
-
 102
102 -
 103
103 -
 104
104 -
 105
105 -
 106
106 -
 107
107 -
 108
108 -
 109
109 -
 110
110 -
 111
111 -
 112
112 -
 113
113 -
 114
114 -
 115
115 -
 116
116 -
 117
117 -
 118
118 -
 119
119 -
 120
120 -
 121
121 -
 122
122 -
123
-
124
-
125
-
126
-
127
-
128
-
129
-
130
-
131
-
132
-
133
-
134
-
135
-
136
-
137
-
138
-
139
-
140
-
141
-
142
-
143
-
144
-
145
-
146
-
147
-
148
-
149
-
150
-
151
-
152
-
153
-
154
-
155
-
156
-
157
-
158
-
159
-
160
-
161
-
162
-
163
-
164
-
165
-
166
-
167
-
168
-
169
-
170
-
171
-
172
-
173
-
174
-
175
-
176
-
177
-
178
-
179
-
180
-
181
-
182
-
183
-
184
-
185
-
186
-
187
-
188
-
189
-
190
-
191
-
192
-
193
-
194
-
195
-
196
-
197
-
198
-
199
-
200
-
201
-
202
-
203
-
204
-
205
-
206
-
207
-
208
-
209
-
210
-
211
 |
 |

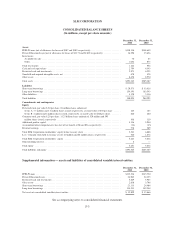
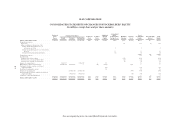
SLM CORPORATION
CONSOLIDATED BALANCE SHEETS
(In millions, except per share amounts)
December 31,
2011
December 31,
2010
Assets
FFELP Loans (net of allowance for losses of $187 and $189, respectively) .......................... $138,130 $148,649
Private Education Loans (net of allowance for losses of $2,171 and $2,022 respectively) ............... 36,290 35,656
Investments
Available-for-sale ..................................................................... 70 83
Other ............................................................................... 1,052 873
Total investments ....................................................................... 1,122 956
Cash and cash equivalents ................................................................ 2,794 4,343
Restricted cash and investments ............................................................ 5,873 6,255
Goodwill and acquired intangible assets, net .................................................. 478 478
Other assets ........................................................................... 8,658 8,970
Total assets ............................................................................ $193,345 $205,307
Liabilities
Short-term borrowings ................................................................... $ 29,573 $ 33,616
Long-term borrowings ................................................................... 154,393 163,543
Other liabilities ......................................................................... 4,128 3,136
Total liabilities ......................................................................... 188,094 200,295
Commitments and contingencies
Equity
Preferred stock, par value $.20 per share, 20 million shares authorized
Series A: 3.3 million and 3.3 million shares issued, respectively, at stated value of $50 per share ...... 165 165
Series B: 4 million and 4 million shares issued, respectively, at stated value of $100 per share ......... 400 400
Common stock, par value $.20 per share, 1.125 billion shares authorized: 529 million and 595
million shares issued, respectively ........................................................ 106 119
Additional paid-in capital ................................................................. 4,136 5,940
Accumulated other comprehensive loss (net of tax benefit of $8 and $26, respectively) ................ (14) (45)
Retained earnings ....................................................................... 770 309
Total SLM Corporation stockholders’ equity before treasury stock ................................ 5,563 6,888
Less: Common stock held in treasury at cost: 20 million and 68 million shares, respectively ............ 320 1,876
Total SLM Corporation stockholders’ equity ................................................. 5,243 5,012
Noncontrolling interest ................................................................... 8 —
Total equity ........................................................................... 5,251 5,012
Total liabilities and equity ................................................................ $193,345 $205,307
Supplemental information — assets and liabilities of consolidated variable interest entities:
December 31,
2011
December 31,
2010
FFELP Loans .......................................................................... $135,536 $145,750
Private Education Loans .................................................................. 24,962 24,355
Restricted cash and investments ............................................................ 5,609 5,983
Other assets ........................................................................... 2,638 3,706
Short-term borrowings ................................................................... 21,313 24,484
Long-term borrowings ................................................................... 134,533 142,244
Net assets of consolidated variable interest entities ............................................. $ 12,899 $ 13,066
See accompanying notes to consolidated financial statements.
F-3