Sallie Mae 2011 Annual Report Download - page 73
Download and view the complete annual report
Please find page 73 of the 2011 Sallie Mae annual report below. You can navigate through the pages in the report by either clicking on the pages listed below, or by using the keyword search tool below to find specific information within the annual report.-
 1
1 -
2
-
3
-
4
-
5
-
6
-
7
-
8
-
9
-
10
-
11
-
12
-
13
-
14
-
15
-
16
-
17
-
18
-
19
-
20
-
21
-
22
-
23
-
24
-
25
-
26
-
27
-
28
-
29
-
30
-
31
-
32
-
33
-
34
-
35
-
36
-
37
-
38
-
39
-
40
-
41
-
42
-
43
-
44
-
45
-
46
-
47
-
48
-
49
-
50
-
51
-
52
-
53
-
54
-
55
-
56
-
57
-
58
-
59
-
60
-
61
-
62
-
 63
63 -
 64
64 -
 65
65 -
 66
66 -
 67
67 -
 68
68 -
 69
69 -
 70
70 -
 71
71 -
 72
72 -
 73
73 -
 74
74 -
 75
75 -
 76
76 -
 77
77 -
 78
78 -
 79
79 -
 80
80 -
 81
81 -
 82
82 -
 83
83 -
84
-
85
-
86
-
87
-
88
-
89
-
90
-
91
-
92
-
93
-
94
-
95
-
96
-
97
-
98
-
99
-
100
-
101
-
102
-
103
-
104
-
105
-
106
-
107
-
108
-
109
-
110
-
111
-
112
-
113
-
114
-
115
-
116
-
117
-
118
-
119
-
120
-
121
-
122
-
123
-
124
-
125
-
126
-
127
-
128
-
129
-
130
-
131
-
132
-
133
-
134
-
135
-
136
-
137
-
138
-
139
-
140
-
141
-
142
-
143
-
144
-
145
-
146
-
147
-
148
-
149
-
150
-
151
-
152
-
153
-
154
-
155
-
156
-
157
-
158
-
159
-
160
-
161
-
162
-
163
-
164
-
165
-
166
-
167
-
168
-
169
-
170
-
171
-
172
-
173
-
174
-
175
-
176
-
177
-
178
-
179
-
180
-
181
-
182
-
183
-
184
-
185
-
186
-
187
-
188
-
189
-
190
-
191
-
192
-
193
-
194
-
195
-
196
-
197
-
198
-
199
-
200
-
201
-
202
-
203
-
204
-
205
-
206
-
207
-
208
-
209
-
210
-
211
 |
 |

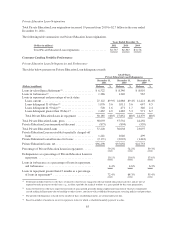
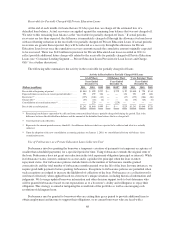
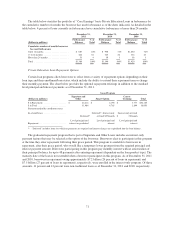
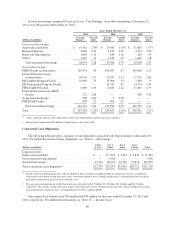
The table below stratifies the portfolio of “Core Earnings” basis Private Education Loans in forbearance by
the cumulative number of months the borrower has used forbearance as of the dates indicated. As detailed in the
table below, 4 percent of loans currently in forbearance have cumulative forbearance of more than 24 months.
December 31,
2011
December 31,
2010
December 31,
2009
(Dollars in millions)
Forbearance
Balance
%of
Total
Forbearance
Balance
%of
Total
Forbearance
Balance
%of
Total
Cumulative number of months borrower
has used forbearance
Up to 12 months ..................... $ 887 64% $ 958 71% $1,050 74%
13 to 24 months ...................... 446 32 343 26 332 23
More than 24 months .................. 53 4 39 3 38 3
Total .............................. $1,386 100% $1,340 100% $1,420 100%
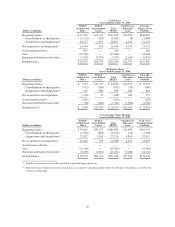
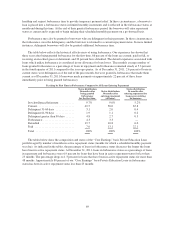
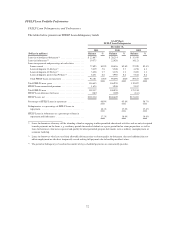
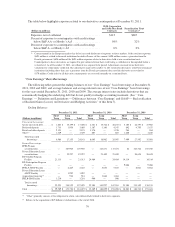
Private Education Loan Repayment Options
Certain loan programs allow borrowers to select from a variety of repayment options depending on their
loan type and their enrollment/loan status, which include the ability to extend their repayment term or change
their monthly payment. The chart below provides the optional repayment offerings in addition to the standard
level principal and interest payments as of December 31, 2011.
Loan Program
(Dollars in millions)
Signature and
Other Smart Option
Career
Training Total
$ in Repayment .................... $ 24,212 $ 4,196 $ 1,777 $30,185
$ in Total ......................... 31,484 4,765 1,844 38,093
Payment method by enrollment status:
In-school/Grace ....................
Deferred(1)
Deferred(1), Interest-only
or fixed $25/month
Interest-only or fixed
$ 25/month
Repayment ........................
Level principal and
interest or graduated
Level principal and
interest
Level principal and
interest
(1) “Deferred” includes loans for which no payments are required and interest charges are capitalized into the loan balance.
The graduated repayment program that is part of Signature and Other Loans includes an interest-only
payment feature that may be selected at the option of the borrower. Borrowers elect to participate in this program
at the time they enter repayment following their grace period. This program is available to borrowers in
repayment, after their grace period, who would like a temporary lower payment from the required principal and
interest payment amount. Borrowers participating in this program pay monthly interest with no amortization of
their principal balance for up to 48 payments after entering repayment (dependent on the loan product type). The
maturity date of the loan is not extended when a borrower participates in this program. As of December 31, 2011
and 2010, borrowers in repayment owing approximately $7.2 billion (24 percent of loans in repayment) and
$7.5 billion (27 percent of loans in repayment), respectively, were enrolled in the interest-only program. Of these
amounts, 11 percent and 12 percent were non-traditional loans as of December 31, 2011 and 2010, respectively.
71