Sallie Mae 2011 Annual Report Download - page 172
Download and view the complete annual report
Please find page 172 of the 2011 Sallie Mae annual report below. You can navigate through the pages in the report by either clicking on the pages listed below, or by using the keyword search tool below to find specific information within the annual report.-
 1
1 -
2
-
3
-
4
-
5
-
6
-
7
-
8
-
9
-
10
-
11
-
12
-
13
-
14
-
15
-
16
-
17
-
18
-
19
-
20
-
21
-
22
-
23
-
24
-
25
-
26
-
27
-
28
-
29
-
30
-
31
-
32
-
33
-
34
-
35
-
36
-
37
-
38
-
39
-
40
-
41
-
42
-
43
-
44
-
45
-
46
-
47
-
48
-
49
-
50
-
51
-
52
-
53
-
54
-
55
-
56
-
57
-
58
-
59
-
60
-
61
-
62
-
63
-
64
-
65
-
66
-
67
-
68
-
69
-
70
-
71
-
72
-
73
-
74
-
75
-
76
-
77
-
78
-
79
-
80
-
81
-
82
-
83
-
84
-
85
-
86
-
87
-
88
-
89
-
90
-
91
-
92
-
93
-
94
-
95
-
96
-
97
-
98
-
99
-
100
-
101
-
102
-
103
-
104
-
105
-
106
-
107
-
108
-
109
-
110
-
111
-
112
-
113
-
114
-
115
-
116
-
117
-
118
-
119
-
120
-
121
-
122
-
123
-
124
-
125
-
126
-
127
-
128
-
129
-
130
-
131
-
132
-
133
-
134
-
135
-
136
-
137
-
138
-
139
-
140
-
141
-
142
-
143
-
144
-
145
-
146
-
147
-
148
-
149
-
150
-
151
-
152
-
153
-
154
-
155
-
156
-
157
-
158
-
159
-
160
-
161
-
 162
162 -
 163
163 -
 164
164 -
 165
165 -
 166
166 -
 167
167 -
 168
168 -
 169
169 -
 170
170 -
 171
171 -
 172
172 -
 173
173 -
 174
174 -
 175
175 -
 176
176 -
 177
177 -
 178
178 -
 179
179 -
 180
180 -
 181
181 -
 182
182 -
183
-
184
-
185
-
186
-
187
-
188
-
189
-
190
-
191
-
192
-
193
-
194
-
195
-
196
-
197
-
198
-
199
-
200
-
201
-
202
-
203
-
204
-
205
-
206
-
207
-
208
-
209
-
210
-
211
 |
 |

SLM CORPORATION
NOTES TO CONSOLIDATED FINANCIAL STATEMENTS (Continued)
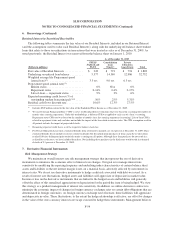
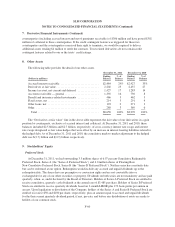
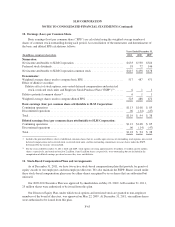
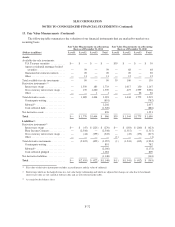
10. Earnings (Loss) per Common Share
Basic earnings (loss) per common share (“EPS”) are calculated using the weighted average number of
shares of common stock outstanding during each period. A reconciliation of the numerators and denominators of
the basic and diluted EPS calculations follows.
Years Ended December 31,
(In millions, except per share data) 2011 2010 2009
Numerator:
Net income attributable to SLM Corporation .................................. $633 $530 $324
Preferred stock dividends .................................................. 18 72 146
Net income attributable to SLM Corporation common stock ...................... $615 $458 $178
Denominator:
Weighted average shares used to compute basic EPS ............................ 517 487 471
Effect of dilutive securities:
Dilutive effect of stock options, non-vested deferred compensation and restricted
stock, restricted stock units and Employee Stock Purchase Plan (“ESPP”)(1) ...... 6 1 1
Dilutive potential common shares(2) .......................................... 6 1 1
Weighted average shares used to compute diluted EPS .......................... 523 488 472
Basic earnings (loss) per common share attributable to SLM Corporation:
Continuing operations .................................................... $1.13 $1.08 $ .85
Discontinued operations ................................................... .06 (.14) (.47)
Total .................................................................. $1.19 $ .94 $ .38
Diluted earnings (loss) per common share attributable to SLM Corporation:
Continuing operations .................................................... $1.12 $1.08 $ .85
Discontinued operations ................................................... .06 (.14) (.47)
Total .................................................................. $1.18 $ .94 $ .38
(1) Includes the potential dilutive effect of additional common shares that are issuable upon exercise of outstanding stock options, non-vested
deferred compensation and restricted stock, restricted stock units, and the outstanding commitment to issue shares under the ESPP,
determined by the treasury stock method.
(2) For the years ended December 31, 2011, 2010 and 2009, stock options covering approximately 16 million, 15 million and 42 million
shares, respectively, and restricted stock of 2 million, 0 and 1 million shares, respectively, were outstanding but not included in the
computation of diluted earnings per share because they were anti-dilutive.
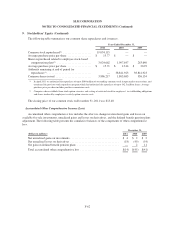
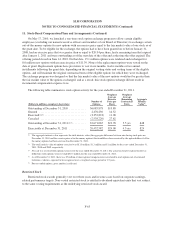
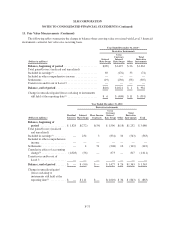
11. Stock-Based Compensation Plans and Arrangements
As of December 31, 2011, we have two active stock-based compensation plans that provide for grants of
equity awards to our employees and non-employee directors. We also maintain the ESPP. Shares issued under
these stock-based compensation plans may be either shares reacquired by us or shares that are authorized but
unissued.
Our 2009-2012 Incentive Plan was approved by shareholders on May 22, 2009. At December 31, 2011,
25 million shares were authorized to be issued from this plan.
Our Directors Equity Plan, under which stock options and restricted stock are granted to non-employee
members of the board of directors, was approved on May 22, 2009. At December 31, 2011, one million shares
were authorized to be issued from this plan.
F-63