Sallie Mae 2011 Annual Report Download - page 133
Download and view the complete annual report
Please find page 133 of the 2011 Sallie Mae annual report below. You can navigate through the pages in the report by either clicking on the pages listed below, or by using the keyword search tool below to find specific information within the annual report.-
 1
1 -
2
-
3
-
4
-
5
-
6
-
7
-
8
-
9
-
10
-
11
-
12
-
13
-
14
-
15
-
16
-
17
-
18
-
19
-
20
-
21
-
22
-
23
-
24
-
25
-
26
-
27
-
28
-
29
-
30
-
31
-
32
-
33
-
34
-
35
-
36
-
37
-
38
-
39
-
40
-
41
-
42
-
43
-
44
-
45
-
46
-
47
-
48
-
49
-
50
-
51
-
52
-
53
-
54
-
55
-
56
-
57
-
58
-
59
-
60
-
61
-
62
-
63
-
64
-
65
-
66
-
67
-
68
-
69
-
70
-
71
-
72
-
73
-
74
-
75
-
76
-
77
-
78
-
79
-
80
-
81
-
82
-
83
-
84
-
85
-
86
-
87
-
88
-
89
-
90
-
91
-
92
-
93
-
94
-
95
-
96
-
97
-
98
-
99
-
100
-
101
-
102
-
103
-
104
-
105
-
106
-
107
-
108
-
109
-
110
-
111
-
112
-
113
-
114
-
115
-
116
-
117
-
118
-
119
-
120
-
121
-
122
-
 123
123 -
 124
124 -
 125
125 -
 126
126 -
 127
127 -
 128
128 -
 129
129 -
 130
130 -
 131
131 -
 132
132 -
 133
133 -
 134
134 -
 135
135 -
 136
136 -
 137
137 -
 138
138 -
 139
139 -
 140
140 -
 141
141 -
 142
142 -
 143
143 -
144
-
145
-
146
-
147
-
148
-
149
-
150
-
151
-
152
-
153
-
154
-
155
-
156
-
157
-
158
-
159
-
160
-
161
-
162
-
163
-
164
-
165
-
166
-
167
-
168
-
169
-
170
-
171
-
172
-
173
-
174
-
175
-
176
-
177
-
178
-
179
-
180
-
181
-
182
-
183
-
184
-
185
-
186
-
187
-
188
-
189
-
190
-
191
-
192
-
193
-
194
-
195
-
196
-
197
-
198
-
199
-
200
-
201
-
202
-
203
-
204
-
205
-
206
-
207
-
208
-
209
-
210
-
211
 |
 |
SLM CORPORATION
NOTES TO CONSOLIDATED FINANCIAL STATEMENTS (Continued)
2. Significant Accounting Policies (Continued)
dividends including dividends declared, accretion of discounts on preferred stock including accelerated accretion
when preferred stock is repaid early, and cumulative dividends related to the current dividend period that have
not been declared as of period end). Diluted earnings per common share is computed by dividing income
allocated to common shareholders by the weighted average common shares outstanding plus amounts
representing the dilutive effect of stock options outstanding, restricted stock, restricted stock units, and the
dilution resulting from the conversion of convertible preferred stock, if applicable. See “Note 10—Earnings
(Loss) per Common Share” for further discussion.
Discontinued Operations
A “Component” of a business comprises operations and cash flows that can be clearly distinguished
operationally and for financial reporting purposes from the rest of the Company. When we determine that a
Component of our business has been disposed of or has met the criteria to be classified as held-for-sale such
Component is presented separately as discontinued operations if the operations of the Component have been or
will be eliminated from our ongoing operations and we will have no continuing involvement with the Component
after the disposal transaction is complete. See “Note 17—Discontinued Operations” for further discussion. If a
component is classified as held-for-sale, then it is carried at the lower of its cost basis or fair value.
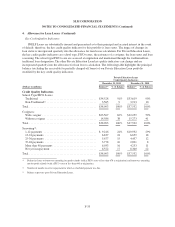
Included within discontinued operations are the accounting results related to our purchasing delinquent and
charged-off receivables on various types of consumer debt with a primary emphasis on charged-off credit card
receivables, and sub-performing and non-performing mortgage loans (Purchased Paper businesses). At
December 31, 2011, we have sold all of these businesses. We accounted for these investments in charged-off
receivables and sub-performing and non-performing mortgage loans by establishing static pools of each quarter’s
purchases and aggregating them based on common risk characteristics. The pools when formed were initially
recorded at fair value, based on each pool’s estimated future cash flows and internal rate of return. We
recognized income each month based on each static pool’s effective interest rate. The static pools were tested
quarterly for impairment by re-estimating the future cash flows to be received from the pools. If the new
estimated cash flows resulted in a pool’s effective interest rate increasing, then this new yield was used
prospectively over the remaining life of the static pool. If the new estimated cash flows resulted in a pool’s
effective interest rate decreasing, the pool was considered impaired and written down through a valuation
allowance to maintain the effective interest rate.
Statement of Cash Flows
Included in our financial statements is the consolidated statement of cash flows. It is our policy to include
all derivative net settlements, irrespective of whether the derivative is a qualifying hedge, in the same section of
the statement of cash flows that the derivative is economically hedging.
As discussed in “Restricted Cash and Investments” of this Note 2, our restricted cash balances primarily
relate to on-balance sheet securitizations. This balance is primarily the result of timing differences between when
principal and interest is collected on the trust assets and when principal and interest is paid on the trust liabilities.
As such, changes in this balance are reflected in investing activities.
Reclassifications
Certain reclassifications have been made to the balances as of and for the years ended December 31, 2010
and 2009, to be consistent with classifications adopted for 2011, which had no impact on net income, total assets
or total liabilities.
F-24