Sallie Mae 2011 Annual Report Download - page 174
Download and view the complete annual report
Please find page 174 of the 2011 Sallie Mae annual report below. You can navigate through the pages in the report by either clicking on the pages listed below, or by using the keyword search tool below to find specific information within the annual report.-
 1
1 -
2
-
3
-
4
-
5
-
6
-
7
-
8
-
9
-
10
-
11
-
12
-
13
-
14
-
15
-
16
-
17
-
18
-
19
-
20
-
21
-
22
-
23
-
24
-
25
-
26
-
27
-
28
-
29
-
30
-
31
-
32
-
33
-
34
-
35
-
36
-
37
-
38
-
39
-
40
-
41
-
42
-
43
-
44
-
45
-
46
-
47
-
48
-
49
-
50
-
51
-
52
-
53
-
54
-
55
-
56
-
57
-
58
-
59
-
60
-
61
-
62
-
63
-
64
-
65
-
66
-
67
-
68
-
69
-
70
-
71
-
72
-
73
-
74
-
75
-
76
-
77
-
78
-
79
-
80
-
81
-
82
-
83
-
84
-
85
-
86
-
87
-
88
-
89
-
90
-
91
-
92
-
93
-
94
-
95
-
96
-
97
-
98
-
99
-
100
-
101
-
102
-
103
-
104
-
105
-
106
-
107
-
108
-
109
-
110
-
111
-
112
-
113
-
114
-
115
-
116
-
117
-
118
-
119
-
120
-
121
-
122
-
123
-
124
-
125
-
126
-
127
-
128
-
129
-
130
-
131
-
132
-
133
-
134
-
135
-
136
-
137
-
138
-
139
-
140
-
141
-
142
-
143
-
144
-
145
-
146
-
147
-
148
-
149
-
150
-
151
-
152
-
153
-
154
-
155
-
156
-
157
-
158
-
159
-
160
-
161
-
162
-
163
-
 164
164 -
 165
165 -
 166
166 -
 167
167 -
 168
168 -
 169
169 -
 170
170 -
 171
171 -
 172
172 -
 173
173 -
 174
174 -
 175
175 -
 176
176 -
 177
177 -
 178
178 -
 179
179 -
 180
180 -
 181
181 -
 182
182 -
 183
183 -
 184
184 -
185
-
186
-
187
-
188
-
189
-
190
-
191
-
192
-
193
-
194
-
195
-
196
-
197
-
198
-
199
-
200
-
201
-
202
-
203
-
204
-
205
-
206
-
207
-
208
-
209
-
210
-
211
 |
 |

SLM CORPORATION
NOTES TO CONSOLIDATED FINANCIAL STATEMENTS (Continued)
11. Stock-Based Compensation Plans and Arrangements (Continued)
On May 17, 2010, we launched a one-time stock option exchange program to allow certain eligible
employees (excluding our named executive officers and members of our Board of Directors) to exchange certain
out-of-the-money options for new options with an exercise price equal to the fair market value of our stock as of
the grant date. To be eligible for the exchange, the options had to have been granted on or before January 31,
2008, had an exercise price that was greater than or equal to $20.94 per share, had a remaining term that expired
after January 1, 2011 and were outstanding as of the start date of the offer and at the time the offer expired. The
offering period closed on June 14, 2010. On that date, 15.1 million options were tendered and exchanged for
8.0 million new options with an exercise price of $11.39. None of the replacement options were vested on the
date of grant. Replacement options have provisions to vest in six months, twelve months or two annual
installments following the grant date, depending on the original vesting status and vesting terms of the eligible
options, and will maintain the original contractual term of the eligible options for which they were exchanged.
The exchange program was designed so that the fair market value of the new options would not be greater than
the fair market value of the options exchanged, and as a result, this stock option exchange did not result in
incremental compensation expense to us.
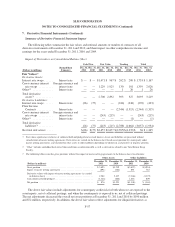
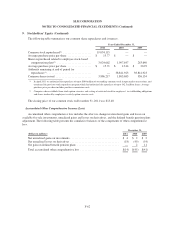
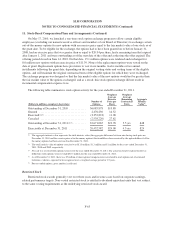
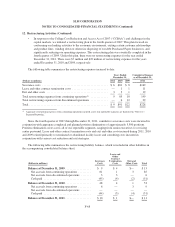
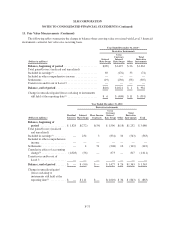
The following table summarizes stock option activity for the year ended December 31, 2011.
(Dollars in millions, except per share data)
Number of
Options
Weighted
Average
Exercise
Price per
Share
Weighted
Average
Remaining
Contractual
Term
Aggregate
Intrinsic
Value(1)
Outstanding at December 31, 2010 ............ 36,085,878 $19.88
Granted ................................. 2,476,230 14.52
Exercised(2)(3) ............................. (3,352,823) 11.08
Canceled ................................ (2,538,220) 27.62
Outstanding at December 31, 2011(4)(5) ......... 32,671,065 $19.78 5.5 yrs $48
Exercisable at December 31, 2011 ............ 20,432,582 $24.08 4.3 yrs $24
(1) The aggregate intrinsic value represents the total intrinsic value (the aggregate difference between our closing stock price on
December 31, 2011 and the exercise price of in-the-money options) that would have been received by the option holders if all in-
the-money options had been exercised on December 31, 2011.
(2) The total intrinsic value of options exercised was $13.8 million, $1.3 million and $.1 million for the years ended December 31,
2011, 2010 and 2009, respectively.
(3) No cash was received from option exercises for the year ended December 31, 2011. The actual tax benefit realized for the tax
deductions from option exercises totaled $5.3 million for the year ended December 31, 2011.
(4) As of December 31, 2011, there was $7 million of unrecognized compensation cost related to stock options net of estimated
forfeitures, which is expected to be recognized over a weighted average period of 1.5 years.
(5) For net-settled options, gross number is reflected.
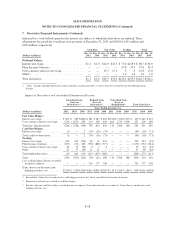
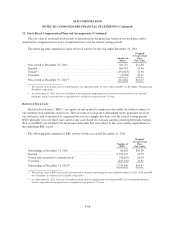
Restricted Stock
Restricted stock awards generally vest over three years and in some cases based on corporate earnings-
related performance targets. Non-vested restricted stock is entitled to dividend equivalent units that vest subject
to the same vesting requirements as the underlying restricted stock award.
F-65