Sallie Mae 2011 Annual Report Download - page 188
Download and view the complete annual report
Please find page 188 of the 2011 Sallie Mae annual report below. You can navigate through the pages in the report by either clicking on the pages listed below, or by using the keyword search tool below to find specific information within the annual report.-
 1
1 -
2
-
3
-
4
-
5
-
6
-
7
-
8
-
9
-
10
-
11
-
12
-
13
-
14
-
15
-
16
-
17
-
18
-
19
-
20
-
21
-
22
-
23
-
24
-
25
-
26
-
27
-
28
-
29
-
30
-
31
-
32
-
33
-
34
-
35
-
36
-
37
-
38
-
39
-
40
-
41
-
42
-
43
-
44
-
45
-
46
-
47
-
48
-
49
-
50
-
51
-
52
-
53
-
54
-
55
-
56
-
57
-
58
-
59
-
60
-
61
-
62
-
63
-
64
-
65
-
66
-
67
-
68
-
69
-
70
-
71
-
72
-
73
-
74
-
75
-
76
-
77
-
78
-
79
-
80
-
81
-
82
-
83
-
84
-
85
-
86
-
87
-
88
-
89
-
90
-
91
-
92
-
93
-
94
-
95
-
96
-
97
-
98
-
99
-
100
-
101
-
102
-
103
-
104
-
105
-
106
-
107
-
108
-
109
-
110
-
111
-
112
-
113
-
114
-
115
-
116
-
117
-
118
-
119
-
120
-
121
-
122
-
123
-
124
-
125
-
126
-
127
-
128
-
129
-
130
-
131
-
132
-
133
-
134
-
135
-
136
-
137
-
138
-
139
-
140
-
141
-
142
-
143
-
144
-
145
-
146
-
147
-
148
-
149
-
150
-
151
-
152
-
153
-
154
-
155
-
156
-
157
-
158
-
159
-
160
-
161
-
162
-
163
-
164
-
165
-
166
-
167
-
168
-
169
-
170
-
171
-
172
-
173
-
174
-
175
-
176
-
177
-
 178
178 -
 179
179 -
 180
180 -
 181
181 -
 182
182 -
 183
183 -
 184
184 -
 185
185 -
 186
186 -
 187
187 -
 188
188 -
 189
189 -
 190
190 -
 191
191 -
 192
192 -
 193
193 -
 194
194 -
 195
195 -
 196
196 -
 197
197 -
 198
198 -
199
-
200
-
201
-
202
-
203
-
204
-
205
-
206
-
207
-
208
-
209
-
210
-
211
 |
 |

SLM CORPORATION
NOTES TO CONSOLIDATED FINANCIAL STATEMENTS (Continued)
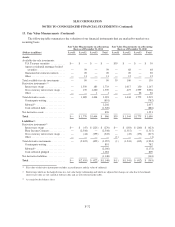
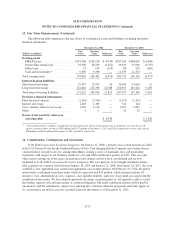
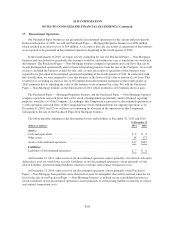
15. Income Taxes (Continued)
The tax effect of temporary differences that give rise to deferred tax assets and liabilities include the following:
December 31,
(Dollars in millions) 2011 2010
Deferred tax assets:
Loan reserves ..................................................... $ 959 $ 909
Market value adjustments on student loans, investments and derivatives ...... 595 480
Stock-based compensation plans ...................................... 78 73
Deferred revenue .................................................. 62 71
Accrued expenses not currently deductible .............................. 51 53
Operating loss and credit carryovers ................................... 49 22
Student loan premiums and discounts, net .............................. 43 47
Intangible assets .................................................. 2 80
Other ........................................................... 3 82
Total deferred tax assets ............................................ 1,842 1,817
Deferred tax liabilities:
Gains/(losses) on repurchased debt .................................... 297 300
Leases .......................................................... 37 53
Other ........................................................... 37 26
Total deferred tax liabilities ......................................... 371 379
Net deferred tax assets .............................................. $1,471 $1,438
Included in other deferred tax assets is a valuation allowance of $31 million and $33 million as of
December 31, 2011 and 2010, respectively, against a portion of the Company’s federal, state and international
deferred tax assets. The valuation allowance is primarily attributable to deferred tax assets for federal and state
capital loss carryovers and state and international net operating loss carryovers that management believes it is more
likely than not will expire prior to being realized. The ultimate realization of the deferred tax assets is dependent
upon the generation of future taxable income of the appropriate character (i.e. capital or ordinary) during the period
in which the temporary differences become deductible. Management considers, among other things, the economic
slowdown, the scheduled reversals of deferred tax liabilities, and the history of positive taxable income available for
net operating loss carrybacks in evaluating the realizability of the deferred tax assets.
As of December 31, 2011, we have apportioned state net operating loss carryforwards of $375 million
which begin to expire in 2013, state capital loss carryovers of $7 million which begin to expire in 2014,
international net operating loss carryforwards of $.5 million which begin to expire in 2032, and federal and state
credit carryovers of $.3 million which begin to expire in 2020.
Accounting for Uncertainty in Income Taxes
The following table summarizes changes in unrecognized tax benefits:
December 31,
(Dollars in millions) 2011 2010 2009
Unrecognized tax benefits at beginning of year ................... $41.7 $104.4 $ 86.4
Increases resulting from tax positions taken during a prior period ...... 20.5 13.1 75.2
Decreases resulting from tax positions taken during a prior period ..... (2.1) (47.5) (58.3)
Increases/(decreases) resulting from tax positions taken during the
current period ............................................. (9.1) (2.5) (22.5)
Decreases related to settlements with taxing authorities .............. — (87.6) (17.9)
Increases related to settlements with taxing authorities ............... 0.4 69.1 44.7
Reductions related to the lapse of statute of limitations .............. (5.5) (7.3) (3.2)
Unrecognized tax benefits at end of year ........................ $45.9 $ 41.7 $104.4
F-79