Sallie Mae 2011 Annual Report Download - page 65
Download and view the complete annual report
Please find page 65 of the 2011 Sallie Mae annual report below. You can navigate through the pages in the report by either clicking on the pages listed below, or by using the keyword search tool below to find specific information within the annual report.-
 1
1 -
2
-
3
-
4
-
5
-
6
-
7
-
8
-
9
-
10
-
11
-
12
-
13
-
14
-
15
-
16
-
17
-
18
-
19
-
20
-
21
-
22
-
23
-
24
-
25
-
26
-
27
-
28
-
29
-
30
-
31
-
32
-
33
-
34
-
35
-
36
-
37
-
38
-
39
-
40
-
41
-
42
-
43
-
44
-
45
-
46
-
47
-
48
-
49
-
50
-
51
-
52
-
53
-
54
-
 55
55 -
 56
56 -
 57
57 -
 58
58 -
 59
59 -
 60
60 -
 61
61 -
 62
62 -
 63
63 -
 64
64 -
 65
65 -
 66
66 -
 67
67 -
 68
68 -
 69
69 -
 70
70 -
 71
71 -
 72
72 -
 73
73 -
 74
74 -
 75
75 -
76
-
77
-
78
-
79
-
80
-
81
-
82
-
83
-
84
-
85
-
86
-
87
-
88
-
89
-
90
-
91
-
92
-
93
-
94
-
95
-
96
-
97
-
98
-
99
-
100
-
101
-
102
-
103
-
104
-
105
-
106
-
107
-
108
-
109
-
110
-
111
-
112
-
113
-
114
-
115
-
116
-
117
-
118
-
119
-
120
-
121
-
122
-
123
-
124
-
125
-
126
-
127
-
128
-
129
-
130
-
131
-
132
-
133
-
134
-
135
-
136
-
137
-
138
-
139
-
140
-
141
-
142
-
143
-
144
-
145
-
146
-
147
-
148
-
149
-
150
-
151
-
152
-
153
-
154
-
155
-
156
-
157
-
158
-
159
-
160
-
161
-
162
-
163
-
164
-
165
-
166
-
167
-
168
-
169
-
170
-
171
-
172
-
173
-
174
-
175
-
176
-
177
-
178
-
179
-
180
-
181
-
182
-
183
-
184
-
185
-
186
-
187
-
188
-
189
-
190
-
191
-
192
-
193
-
194
-
195
-
196
-
197
-
198
-
199
-
200
-
201
-
202
-
203
-
204
-
205
-
206
-
207
-
208
-
209
-
210
-
211
 |
 |

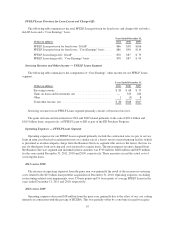
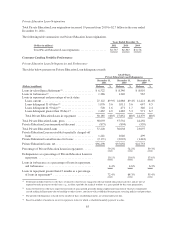
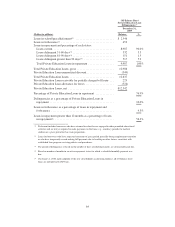
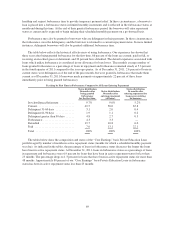
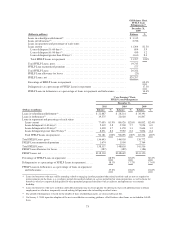
Private Education Loan Originations
Total Private Education Loan originations increased 19 percent from 2010 to $2.7 billion in the year ended
December 31, 2011.
The following table summarizes our Private Education Loan originations.
Years Ended December 31,
(Dollars in millions) 2011 2010 2009
Total Private Education Loan originations ................... $2,737 $2,307 $3,176
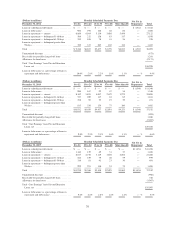
Consumer Lending Portfolio Performance
Private Education Loan Delinquencies and Forbearance
The tables below present our Private Education Loan delinquency trends.
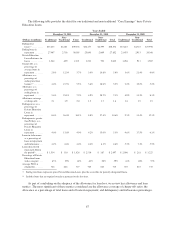
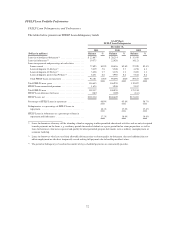
GAAP-Basis
Private Education Loan Delinquencies
December 31,
2011
December 31,
2010
December 31,
2009
(Dollars in millions) Balance % Balance % Balance %
Loans in-school/grace/deferment(1) ..................... $ 6,522 $ 8,340 $ 8,910
Loans in forbearance(2) .............................. 1,386 1,340 967
Loans in repayment and percentage of each status:
Loans current .................................... 27,122 89.9% 24,888 89.4% 12,421 86.4%
Loans delinquent 31-60 days(3) ...................... 1,076 3.6 1,011 3.6 647 4.5
Loans delinquent 61-90 days(3) ...................... 520 1.6 471 1.7 340 2.4
Loans delinquent greater than 90 days(3) ............... 1,467 4.9 1,482 5.3 971 6.7
Total Private Education Loans in repayment ........... 30,185 100% 27,852 100% 14,379 100%
Total Private Education Loans, gross ................... 38,093 37,532 24,256
Private Education Loan unamortized discount ............ (873) (894) (559)
Total Private Education Loans ........................ 37,220 36,638 23,697
Private Education Loan receivable for partially charged-off
loans .......................................... 1,241 1,040 499
Private Education Loan allowance for losses ............. (2,171) (2,022) (1,443)
Private Education Loans, net .......................... $36,290 $35,656 $22,753
Percentage of Private Education Loans in repayment ....... 79.2% 74.2% 59.3%
Delinquencies as a percentage of Private Education Loans in
repayment ...................................... 10.1% 10.6% 13.6%
Loans in forbearance as a percentage of loans in repayment
and forbearance .................................. 4.4% 4.6% 6.3%
Loans in repayment greater than 12 months as a percentage
of loans in repayment(4) ............................ 72.4% 64.3% 55.4%
(1) Deferment includes borrowers who have returned to school or are engaged in other permitted educational activities and are not yet
required to make payments on the loans, e.g., residency periods for medical students or a grace period for bar exam preparation.
(2) Loans for borrowers who have requested extension of grace period generally during employment transition or who have temporarily
ceased making full payments due to hardship or other factors, consistent with established loan program servicing policies and procedures.
(3) The period of delinquency is based on the number of days scheduled payments are contractually past due.
(4) Based on number of months in an active repayment status for which a scheduled monthly payment was due.
63