Sallie Mae 2011 Annual Report Download - page 85
Download and view the complete annual report
Please find page 85 of the 2011 Sallie Mae annual report below. You can navigate through the pages in the report by either clicking on the pages listed below, or by using the keyword search tool below to find specific information within the annual report.-
 1
1 -
2
-
3
-
4
-
5
-
6
-
7
-
8
-
9
-
10
-
11
-
12
-
13
-
14
-
15
-
16
-
17
-
18
-
19
-
20
-
21
-
22
-
23
-
24
-
25
-
26
-
27
-
28
-
29
-
30
-
31
-
32
-
33
-
34
-
35
-
36
-
37
-
38
-
39
-
40
-
41
-
42
-
43
-
44
-
45
-
46
-
47
-
48
-
49
-
50
-
51
-
52
-
53
-
54
-
55
-
56
-
57
-
58
-
59
-
60
-
61
-
62
-
63
-
64
-
65
-
66
-
67
-
68
-
69
-
70
-
71
-
72
-
73
-
74
-
 75
75 -
 76
76 -
 77
77 -
 78
78 -
 79
79 -
 80
80 -
 81
81 -
 82
82 -
 83
83 -
 84
84 -
 85
85 -
 86
86 -
 87
87 -
 88
88 -
 89
89 -
 90
90 -
 91
91 -
 92
92 -
 93
93 -
 94
94 -
 95
95 -
96
-
97
-
98
-
99
-
100
-
101
-
102
-
103
-
104
-
105
-
106
-
107
-
108
-
109
-
110
-
111
-
112
-
113
-
114
-
115
-
116
-
117
-
118
-
119
-
120
-
121
-
122
-
123
-
124
-
125
-
126
-
127
-
128
-
129
-
130
-
131
-
132
-
133
-
134
-
135
-
136
-
137
-
138
-
139
-
140
-
141
-
142
-
143
-
144
-
145
-
146
-
147
-
148
-
149
-
150
-
151
-
152
-
153
-
154
-
155
-
156
-
157
-
158
-
159
-
160
-
161
-
162
-
163
-
164
-
165
-
166
-
167
-
168
-
169
-
170
-
171
-
172
-
173
-
174
-
175
-
176
-
177
-
178
-
179
-
180
-
181
-
182
-
183
-
184
-
185
-
186
-
187
-
188
-
189
-
190
-
191
-
192
-
193
-
194
-
195
-
196
-
197
-
198
-
199
-
200
-
201
-
202
-
203
-
204
-
205
-
206
-
207
-
208
-
209
-
210
-
211
 |
 |
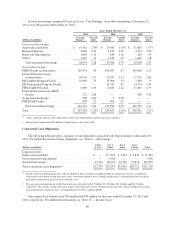
in the future and do not currently expect others to actively consolidate our FFELP loans. As a result, we expect
CPRs related to our FFELP Loans to remain relatively stable over time. See “Business Segment Earnings
Summary — ‘Core Earnings’ Basis — FFELP Loans Segment” of this Item 7, for discussion of the potential
impact of a recent Special Direct Consolidation Loan Initiative. We expect that in the future both we and our
competitors will begin to consolidate Private Education Loans. This is built into the CPR assumption we use for
Private Education Loans. However, it is difficult to accurately project the timing and level at which this
consolidation activity will begin and our assumption may need to be updated by a material amount in the future
based on changes in the economy and marketplace. The level of defaults is a significant component of our
FFELP Loan and Private Education Loan CPR. This component of the FFELP Loan and Private Education Loan
CPR is estimated in the same manner as discussed in “Critical Accounting Policies and Estimates — Allowance
for Loan Loss” of this Item 7 — the only difference is for premium and discount amortization purposes the
estimate of defaults is a life-of-loan estimate whereas for allowance for loan loss it is a two-year estimate.
Fair Value Measurement
The most significant assumptions used in fair value measurements, including those related to credit and
liquidity risk, are as follows:
1. Investments — Our investments primarily consist of overnight/weekly maturity instruments with high
credit quality counterparties. However, we consider credit and liquidity risk involving specific
instruments in determining their fair value and, when appropriate, have adjusted the fair value of these
instruments for the effect of credit and liquidity risk. These assumptions have further been validated by
the successful maturity of these investments in the period immediately following the end of the
reporting period.
2. Derivatives — When determining the fair value of derivatives, we take into account counterparty
credit risk for positions where we are exposed to the counterparty on a net basis by assessing exposure
net of collateral held. The net exposure for each counterparty is adjusted based on market information
available for that specific counterparty, including spreads from credit default swaps. Additionally,
when the counterparty has exposure to us related to our derivatives, we fully collateralize the exposure,
minimizing the adjustment necessary to the derivative valuations for our own credit risk. Trusts that
contain derivatives are not required to post collateral to counterparties as the credit quality and
securitized nature of the trusts minimizes any adjustments for the counterparty’s exposure to the trusts.
Adjustments related to credit risk reduced the overall value of our derivatives by $190 million as of
December 31, 2011. We also take into account changes in liquidity when determining the fair value of
derivative positions. We adjusted the fair value of certain less liquid positions downward by
approximately $111 million to take into account a significant reduction in liquidity as of December 31,
2011, related primarily to basis swaps indexed to interest rate indices with inactive markets. A major
indicator of market inactivity is the widening of the bid/ask spread in these markets. In general, the
widening of counterparty credit spreads and reduced liquidity for derivative instruments as indicated by
wider bid/ask spreads will reduce the fair value of derivatives. In addition, certain cross-currency
interest rate swaps hedging foreign currency denominated reset rate and amortizing notes in our trusts
contain extension features that coincide with the remarketing dates of the notes. The valuation of the
extension feature requires significant judgment based on internally developed inputs.
3. Student Loans — Our FFELP Loans and Private Education Loans are accounted for at cost or at the
lower of cost or fair value if the loan is held-for-sale. The fair values of our student loans are disclosed
in “Note 13 —Fair Value Measurements.” For both FFELP Loans and Private Education Loans
accounted for at cost, fair value is determined by modeling loan level cash flows using stated terms of
the assets and internally-developed assumptions to determine aggregate portfolio yield, net present
value and average life. The significant assumptions used to project cash flows are prepayment speeds,
default rates, cost of funds, the amount funded by debt versus equity, and required return on equity. In
addition, the Floor Income component of our FFELP Loan portfolio is valued through discounted cash
83