Sallie Mae 2011 Annual Report Download - page 166
Download and view the complete annual report
Please find page 166 of the 2011 Sallie Mae annual report below. You can navigate through the pages in the report by either clicking on the pages listed below, or by using the keyword search tool below to find specific information within the annual report.-
 1
1 -
2
-
3
-
4
-
5
-
6
-
7
-
8
-
9
-
10
-
11
-
12
-
13
-
14
-
15
-
16
-
17
-
18
-
19
-
20
-
21
-
22
-
23
-
24
-
25
-
26
-
27
-
28
-
29
-
30
-
31
-
32
-
33
-
34
-
35
-
36
-
37
-
38
-
39
-
40
-
41
-
42
-
43
-
44
-
45
-
46
-
47
-
48
-
49
-
50
-
51
-
52
-
53
-
54
-
55
-
56
-
57
-
58
-
59
-
60
-
61
-
62
-
63
-
64
-
65
-
66
-
67
-
68
-
69
-
70
-
71
-
72
-
73
-
74
-
75
-
76
-
77
-
78
-
79
-
80
-
81
-
82
-
83
-
84
-
85
-
86
-
87
-
88
-
89
-
90
-
91
-
92
-
93
-
94
-
95
-
96
-
97
-
98
-
99
-
100
-
101
-
102
-
103
-
104
-
105
-
106
-
107
-
108
-
109
-
110
-
111
-
112
-
113
-
114
-
115
-
116
-
117
-
118
-
119
-
120
-
121
-
122
-
123
-
124
-
125
-
126
-
127
-
128
-
129
-
130
-
131
-
132
-
133
-
134
-
135
-
136
-
137
-
138
-
139
-
140
-
141
-
142
-
143
-
144
-
145
-
146
-
147
-
148
-
149
-
150
-
151
-
152
-
153
-
154
-
155
-
 156
156 -
 157
157 -
 158
158 -
 159
159 -
 160
160 -
 161
161 -
 162
162 -
 163
163 -
 164
164 -
 165
165 -
 166
166 -
 167
167 -
 168
168 -
 169
169 -
 170
170 -
 171
171 -
 172
172 -
 173
173 -
 174
174 -
 175
175 -
 176
176 -
177
-
178
-
179
-
180
-
181
-
182
-
183
-
184
-
185
-
186
-
187
-
188
-
189
-
190
-
191
-
192
-
193
-
194
-
195
-
196
-
197
-
198
-
199
-
200
-
201
-
202
-
203
-
204
-
205
-
206
-
207
-
208
-
209
-
210
-
211
 |
 |

SLM CORPORATION
NOTES TO CONSOLIDATED FINANCIAL STATEMENTS (Continued)
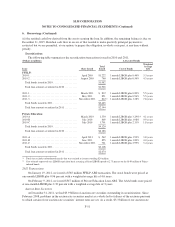
7. Derivative Financial Instruments (Continued)
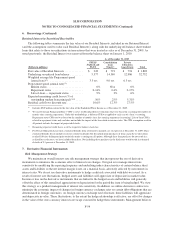
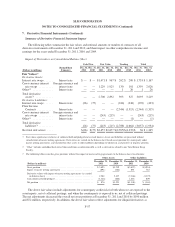
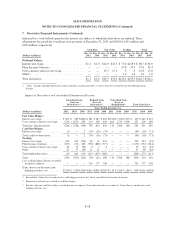
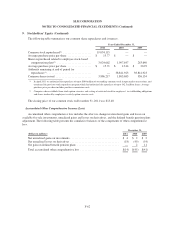
Summary of Derivative Financial Statement Impact
The following tables summarize the fair values and notional amounts or number of contracts of all
derivative instruments at December 31, 2011 and 2010, and their impact on other comprehensive income and
earnings for the years ended December 31, 2011, 2010 and 2009.
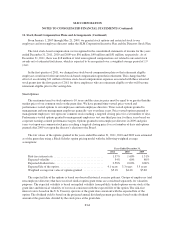
Impact of Derivatives on Consolidated Balance Sheet
Cash Flow Fair Value Trading Total
(Dollars in millions)
Hedged Risk
Exposure
Dec. 31,
2011
Dec. 31,
2010
Dec. 31,
2011
Dec. 31,
2010
Dec. 31,
2011
Dec. 31,
2010
Dec. 31,
2011
Dec. 31,
2010
Fair Values(1)
Derivative Assets:
Interest rate swaps ...... Interest rate $ — $ — $1,471 $ 967 $ 262 $ 200 $ 1,733 $ 1,167
Cross currency interest
rate swaps ..........
Foreign currency and
interest rate — — 1,229 1,925 130 101 1,359 2,026
Other(2) .............. Interest rate — — — — 1 26 1 26
Total derivative
assets(3) ............ — — 2,700 2,892 393 327 3,093 3,219
Derivative Liabilities:
Interest rate swaps ...... Interest rate (26) (75) — — (244) (348) (270) (423)
Floor Income
Contracts ........... Interest rate — — — — (2,544) (1,315) (2,544) (1,315)
Cross currency interest
rate swaps ..........
Foreign currency and
interest rate — — (243) (215) — — (243) (215)
Other(2) .............. Interest rate — — — — — (1) — (1)
Total derivative
liabilities(3) .......... (26) (75) (243) (215) (2,788) (1,664) (3,057) (1,954)
Net total derivatives .... $(26) $(75) $2,457 $2,677 $(2,395)$(1,337)$ 36 $ 1,265
(1) Fair values reported are exclusive of collateral held and pledged and accrued interest. Assets and liabilities are presented without
consideration of master netting agreements. Derivatives are carried on the balance sheet based on net position by counterparty under
master netting agreements, and classified in other assets or other liabilities depending on whether in a net positive or negative position.
(2) “Other” includes embedded derivatives bifurcated from securitization debt as well as derivatives related to our Total Return Swap
Facility.
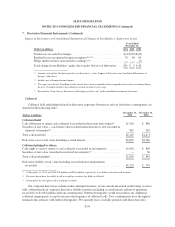
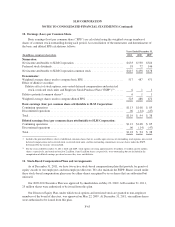
(3) The following table reconciles gross positions without the impact of master netting agreements to the balance sheet classification:
Other Assets Other Liabilities
(Dollars in millions)
December 31,
2011
December 31,
2010
December 31,
2011
December 31,
2010
Gross position ............................................. $3,093 $3,219 $(3,057) $(1,954)
Impact of master netting agreements ............................ (891) (782) 891 782
Derivative values with impact of master netting agreements (as carried
on balance sheet) ......................................... 2,202 2,437 (2,166) (1,172)
Cash collateral (held) pledged ................................. (1,326) (886) 1,018 809
Net position ............................................... $ 876 $1,551 $(1,148) $ (363)
The above fair values include adjustments for counterparty credit risk for both when we are exposed to the
counterparty, net of collateral postings, and when the counterparty is exposed to us, net of collateral postings.
The net adjustments decreased the overall net asset positions at December 31, 2011 and 2010 by $190 million
and $72 million, respectively. In addition, the above fair values reflect adjustments for illiquid derivatives as
F-57