Sallie Mae 2011 Annual Report Download - page 142
Download and view the complete annual report
Please find page 142 of the 2011 Sallie Mae annual report below. You can navigate through the pages in the report by either clicking on the pages listed below, or by using the keyword search tool below to find specific information within the annual report.-
 1
1 -
2
-
3
-
4
-
5
-
6
-
7
-
8
-
9
-
10
-
11
-
12
-
13
-
14
-
15
-
16
-
17
-
18
-
19
-
20
-
21
-
22
-
23
-
24
-
25
-
26
-
27
-
28
-
29
-
30
-
31
-
32
-
33
-
34
-
35
-
36
-
37
-
38
-
39
-
40
-
41
-
42
-
43
-
44
-
45
-
46
-
47
-
48
-
49
-
50
-
51
-
52
-
53
-
54
-
55
-
56
-
57
-
58
-
59
-
60
-
61
-
62
-
63
-
64
-
65
-
66
-
67
-
68
-
69
-
70
-
71
-
72
-
73
-
74
-
75
-
76
-
77
-
78
-
79
-
80
-
81
-
82
-
83
-
84
-
85
-
86
-
87
-
88
-
89
-
90
-
91
-
92
-
93
-
94
-
95
-
96
-
97
-
98
-
99
-
100
-
101
-
102
-
103
-
104
-
105
-
106
-
107
-
108
-
109
-
110
-
111
-
112
-
113
-
114
-
115
-
116
-
117
-
118
-
119
-
120
-
121
-
122
-
123
-
124
-
125
-
126
-
127
-
128
-
129
-
130
-
131
-
 132
132 -
 133
133 -
 134
134 -
 135
135 -
 136
136 -
 137
137 -
 138
138 -
 139
139 -
 140
140 -
 141
141 -
 142
142 -
 143
143 -
 144
144 -
 145
145 -
 146
146 -
 147
147 -
 148
148 -
 149
149 -
 150
150 -
 151
151 -
 152
152 -
153
-
154
-
155
-
156
-
157
-
158
-
159
-
160
-
161
-
162
-
163
-
164
-
165
-
166
-
167
-
168
-
169
-
170
-
171
-
172
-
173
-
174
-
175
-
176
-
177
-
178
-
179
-
180
-
181
-
182
-
183
-
184
-
185
-
186
-
187
-
188
-
189
-
190
-
191
-
192
-
193
-
194
-
195
-
196
-
197
-
198
-
199
-
200
-
201
-
202
-
203
-
204
-
205
-
206
-
207
-
208
-
209
-
210
-
211
 |
 |

SLM CORPORATION
NOTES TO CONSOLIDATED FINANCIAL STATEMENTS (Continued)
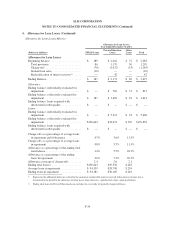
4. Allowance for Loan Losses (Continued)
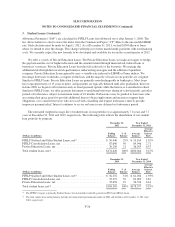
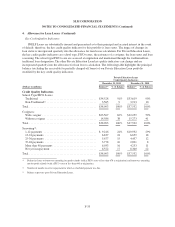
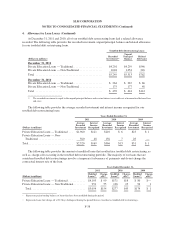
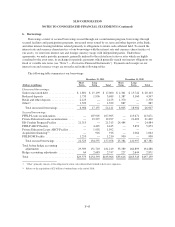
Key Credit Quality Indicators
FFELP Loans are substantially insured and guaranteed as to their principal and accrued interest in the event
of default; therefore, the key credit quality indicator for this portfolio is loan status. The impact of changes in
loan status is incorporated quarterly into the allowance for loan losses calculation. For Private Education Loans,
the key credit quality indicators are school type, FICO scores, the existence of a cosigner, the loan status and loan
seasoning. The school type/FICO score are assessed at origination and maintained through the traditional/non-
traditional loan designation. The other Private Education Loan key quality indicators can change and are
incorporated quarterly into the allowance for loan losses calculation. The following table highlights the principal
balance (excluding the receivable for partially charged-off loans) of our Private Education Loan portfolio
stratified by the key credit quality indicators.
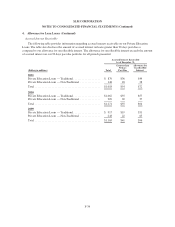
Private Education Loans
Credit Quality Indicators
December 31, 2011 December 31, 2010
(Dollars in millions) Balance(3) % of Balance Balance(3) % of Balance
Credit Quality Indicators
School Type/FICO Scores:
Traditional ........................................ $34,528 91% $33,619 90%
Non-Traditional(1) ................................... 3,565 9 3,913 10
Total ............................................... $38,093 100% $37,532 100%
Cosigners:
With cosigner ...................................... $23,507 62% $22,259 59%
Without cosigner ................................... 14,586 38 15,273 41
Total ............................................... $38,093 100% $37,532 100%
Seasoning(2):
1-12 payments ..................................... $ 9,246 24% $10,932 29%
13-24 payments .................................... 6,837 18 6,659 18
25-36 payments .................................... 5,677 15 4,457 12
37-48 payments .................................... 3,778 10 2,891 8
More than 48 payments .............................. 6,033 16 4,253 11
Not yet in repayment ................................ 6,522 17 8,340 22
Total ............................................... $38,093 100% $37,532 100%
(1) Defined as loans to borrowers attending for-profit schools (with a FICO score of less than 670 at origination) and borrowers attending
not-for-profit schools (with a FICO score of less than 640 at origination).
(2) Number of months in active repayment for which a scheduled payment was due.
(3) Balance represents gross Private Education Loans.
F-33