Sallie Mae 2011 Annual Report Download - page 178
Download and view the complete annual report
Please find page 178 of the 2011 Sallie Mae annual report below. You can navigate through the pages in the report by either clicking on the pages listed below, or by using the keyword search tool below to find specific information within the annual report.-
 1
1 -
2
-
3
-
4
-
5
-
6
-
7
-
8
-
9
-
10
-
11
-
12
-
13
-
14
-
15
-
16
-
17
-
18
-
19
-
20
-
21
-
22
-
23
-
24
-
25
-
26
-
27
-
28
-
29
-
30
-
31
-
32
-
33
-
34
-
35
-
36
-
37
-
38
-
39
-
40
-
41
-
42
-
43
-
44
-
45
-
46
-
47
-
48
-
49
-
50
-
51
-
52
-
53
-
54
-
55
-
56
-
57
-
58
-
59
-
60
-
61
-
62
-
63
-
64
-
65
-
66
-
67
-
68
-
69
-
70
-
71
-
72
-
73
-
74
-
75
-
76
-
77
-
78
-
79
-
80
-
81
-
82
-
83
-
84
-
85
-
86
-
87
-
88
-
89
-
90
-
91
-
92
-
93
-
94
-
95
-
96
-
97
-
98
-
99
-
100
-
101
-
102
-
103
-
104
-
105
-
106
-
107
-
108
-
109
-
110
-
111
-
112
-
113
-
114
-
115
-
116
-
117
-
118
-
119
-
120
-
121
-
122
-
123
-
124
-
125
-
126
-
127
-
128
-
129
-
130
-
131
-
132
-
133
-
134
-
135
-
136
-
137
-
138
-
139
-
140
-
141
-
142
-
143
-
144
-
145
-
146
-
147
-
148
-
149
-
150
-
151
-
152
-
153
-
154
-
155
-
156
-
157
-
158
-
159
-
160
-
161
-
162
-
163
-
164
-
165
-
166
-
167
-
 168
168 -
 169
169 -
 170
170 -
 171
171 -
 172
172 -
 173
173 -
 174
174 -
 175
175 -
 176
176 -
 177
177 -
 178
178 -
 179
179 -
 180
180 -
 181
181 -
 182
182 -
 183
183 -
 184
184 -
 185
185 -
 186
186 -
 187
187 -
 188
188 -
189
-
190
-
191
-
192
-
193
-
194
-
195
-
196
-
197
-
198
-
199
-
200
-
201
-
202
-
203
-
204
-
205
-
206
-
207
-
208
-
209
-
210
-
211
 |
 |
SLM CORPORATION
NOTES TO CONSOLIDATED FINANCIAL STATEMENTS (Continued)
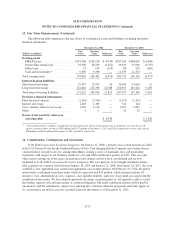
13. Fair Value Measurements
We use estimates of fair value in applying various accounting standards for our financial statements.
We categorize our fair value estimates based on a hierarchical framework associated with three levels of
price transparency utilized in measuring financial instruments at fair value. For additional information regarding
our policies for determining fair value and the hierarchical framework, see “Note 2 — Significant Accounting
Policies — Fair Value Measurement.”
During the year ended December 31, 2011, there were no significant transfers of financial instruments
between levels.
Student Loans
Our FFELP Loans and Private Education Loans are accounted for at cost or at the lower of cost or market if
the loan is held-for-sale. FFELP Loans classified as held-for-sale are those which we have the ability and intent
to sell under various ED loan purchase programs. In these instances, the FFELP Loans are valued using the
committed sales price under the programs. For all other FFELP Loans and Private Education Loans, fair values
were determined by modeling loan cash flows using stated terms of the assets and internally-developed
assumptions to determine aggregate portfolio yield, net present value and average life. The significant
assumptions used to determine fair value are prepayment speeds, default rates, cost of funds, required return on
equity, and expected Repayment Borrower Benefits to be earned. In addition, the Floor Income component of our
FFELP Loan portfolio is valued with option models using both observable market inputs and internally
developed inputs. A number of significant inputs into the models are internally derived and not observable to
market participants. Certain model assumptions were calibrated based upon pricing information related to our
acquisition of the Student Loan Corporation FFELP trusts on December 31, 2010.
Cash and Investments (Including “Restricted Cash and Investments”)
Cash and cash equivalents are carried at cost. Carrying value approximated fair value for disclosure
purposes. Investments classified as trading or available-for-sale are carried at fair value in the financial
statements. Investments in U.S. Treasury securities consisted of Treasury bills that trade in active markets. The
fair value was determined using observable market prices. Investments in mortgage-backed securities are valued
using observable market prices. These securities are primarily collateralized by real estate properties in Utah and
are guaranteed by either a government sponsored enterprise or the U.S. government. Other investments
(primarily municipal bonds) for which observable prices from active markets are not available were valued
through standard bond pricing models using observable market yield curves adjusted for credit and liquidity
spreads. These valuations are immaterial to the overall investment portfolio. The fair value of investments in
commercial paper, asset-backed commercial paper, or demand deposits that have a remaining term of less than
90 days when purchased are estimated at cost and, when needed, adjustments for liquidity and credit spreads are
made depending on market conditions and counterparty credit risks. No additional adjustments were deemed
necessary.
Borrowings
Borrowings are accounted for at cost in the financial statements except when denominated in a foreign
currency or when designated as the hedged item in a fair value hedge relationship. When the hedged risk is the
benchmark interest rate and not full fair value, the cost basis is adjusted for changes in value due to benchmark
interest rates only. Foreign currency-denominated borrowings are re-measured at current spot rates in the
financial statements. The full fair value of all borrowings is disclosed. Fair value was determined through
F-69