Sallie Mae 2011 Annual Report Download - page 163
Download and view the complete annual report
Please find page 163 of the 2011 Sallie Mae annual report below. You can navigate through the pages in the report by either clicking on the pages listed below, or by using the keyword search tool below to find specific information within the annual report.-
 1
1 -
2
-
3
-
4
-
5
-
6
-
7
-
8
-
9
-
10
-
11
-
12
-
13
-
14
-
15
-
16
-
17
-
18
-
19
-
20
-
21
-
22
-
23
-
24
-
25
-
26
-
27
-
28
-
29
-
30
-
31
-
32
-
33
-
34
-
35
-
36
-
37
-
38
-
39
-
40
-
41
-
42
-
43
-
44
-
45
-
46
-
47
-
48
-
49
-
50
-
51
-
52
-
53
-
54
-
55
-
56
-
57
-
58
-
59
-
60
-
61
-
62
-
63
-
64
-
65
-
66
-
67
-
68
-
69
-
70
-
71
-
72
-
73
-
74
-
75
-
76
-
77
-
78
-
79
-
80
-
81
-
82
-
83
-
84
-
85
-
86
-
87
-
88
-
89
-
90
-
91
-
92
-
93
-
94
-
95
-
96
-
97
-
98
-
99
-
100
-
101
-
102
-
103
-
104
-
105
-
106
-
107
-
108
-
109
-
110
-
111
-
112
-
113
-
114
-
115
-
116
-
117
-
118
-
119
-
120
-
121
-
122
-
123
-
124
-
125
-
126
-
127
-
128
-
129
-
130
-
131
-
132
-
133
-
134
-
135
-
136
-
137
-
138
-
139
-
140
-
141
-
142
-
143
-
144
-
145
-
146
-
147
-
148
-
149
-
150
-
151
-
152
-
 153
153 -
 154
154 -
 155
155 -
 156
156 -
 157
157 -
 158
158 -
 159
159 -
 160
160 -
 161
161 -
 162
162 -
 163
163 -
 164
164 -
 165
165 -
 166
166 -
 167
167 -
 168
168 -
 169
169 -
 170
170 -
 171
171 -
 172
172 -
 173
173 -
174
-
175
-
176
-
177
-
178
-
179
-
180
-
181
-
182
-
183
-
184
-
185
-
186
-
187
-
188
-
189
-
190
-
191
-
192
-
193
-
194
-
195
-
196
-
197
-
198
-
199
-
200
-
201
-
202
-
203
-
204
-
205
-
206
-
207
-
208
-
209
-
210
-
211
 |
 |

SLM CORPORATION
NOTES TO CONSOLIDATED FINANCIAL STATEMENTS (Continued)
6. Borrowings (Continued)
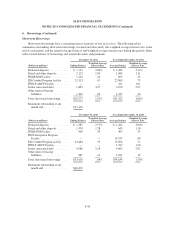
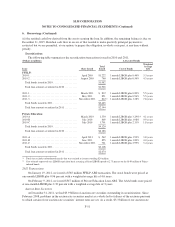
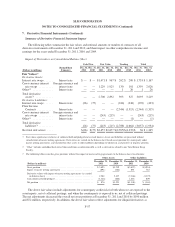
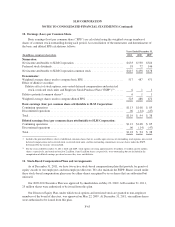
Retained Interest in Securitized Receivables
The following tables summarize the fair value of our Residual Interests, included in our Retained Interest
(and the assumptions used to value such Residual Interests), along with the underlying off-balance sheet student
loans that relate to those securitizations in transactions that were treated as sales as of December 31, 2009. As
noted previously, the Residual Interest was removed from the balance sheet on January 1, 2010.
As of December 31, 2009
(Dollars in millions)
FFELP
Stafford and
PLUS
Consolidation
Loan
Trusts(1)
Private
Education
Loan Trusts Total
Fair value of Residual Interests ............. $ 243 $ 791 $ 794 $ 1,828
Underlying securitized loan balance ......... 5,377 14,369 12,986 32,732
Weighted average life Prepayment speed
(annual rate)(2): ....................... 3.3yrs. 9.0 yrs. 6.3 yrs.
Prepayment speed (annual rate)(2):
Interim status ......................... 0% N/A 0%
Repayment status ..................... 0-14% 2-4% 2-15%
Life-of-loan — repayment status ......... 9% 3% 6%
Expected remaining credit losses (% of
outstanding student loan principal)(3)(4) ..... .10% .25% 5.31%
Residual cash flows discount rate ........... 10.6% 12.3% 27.5%
(1) Includes $569 million related to the fair value of the Embedded Floor Income as of December 31, 2009.
(2) We used Constant Prepayment Rate (“CPR”) curves for Residual Interest valuations that were based on seasoning (the number of
months since entering repayment). Under this methodology, a different CPR was applied to each year of a loan’s seasoning.
Repayment status CPR used was based on the number of months since first entering repayment (seasoning). Life-of-loan CPR is
related to repayment status only and does not include the impact of the loan while in interim status. The CPR assumption used for
all periods includes the impact of projected defaults.
(3) Remaining expected credit losses as of the respective balance sheet date.
(4) For Private Education Loan trusts, estimated defaults from settlement to maturity are 12.2 percent at December 31, 2009. These
estimated defaults do not include recoveries related to defaults but do include prior purchases of loans at par by us when loans
reached 180 days delinquent (prior to default) under a contingent call option. Although these loan purchases do not result in a
realized loss to the trust, we have included them here. Not including these purchases in the disclosure would result in estimated
defaults of 9.3 percent at December 31, 2009.
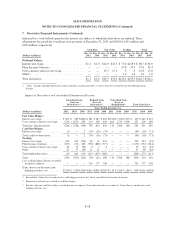
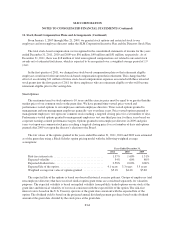
7. Derivative Financial Instruments
Risk Management Strategy
We maintain an overall interest rate risk management strategy that incorporates the use of derivative
instruments to minimize the economic effect of interest rate changes. Our goal is to manage interest rate
sensitivity by modifying the repricing frequency and underlying index characteristics of certain balance sheet
assets and liabilities so the net interest margin is not, on a material basis, adversely affected by movements in
interest rates. We do not use derivative instruments to hedge credit risk associated with debt we issued. As a
result of interest rate fluctuations, hedged assets and liabilities will appreciate or depreciate in market value.
Income or loss on the derivative instruments that are linked to the hedged assets and liabilities will generally
offset the effect of this unrealized appreciation or depreciation for the period the item is being hedged. We view
this strategy as a prudent management of interest rate sensitivity. In addition, we utilize derivative contracts to
minimize the economic impact of changes in foreign currency exchange rates on certain debt obligations that are
denominated in foreign currencies. As foreign currency exchange rates fluctuate, these liabilities will appreciate
and depreciate in value. These fluctuations, to the extent the hedge relationship is effective, are offset by changes
in the value of the cross-currency interest rate swaps executed to hedge these instruments. Management believes
F-54